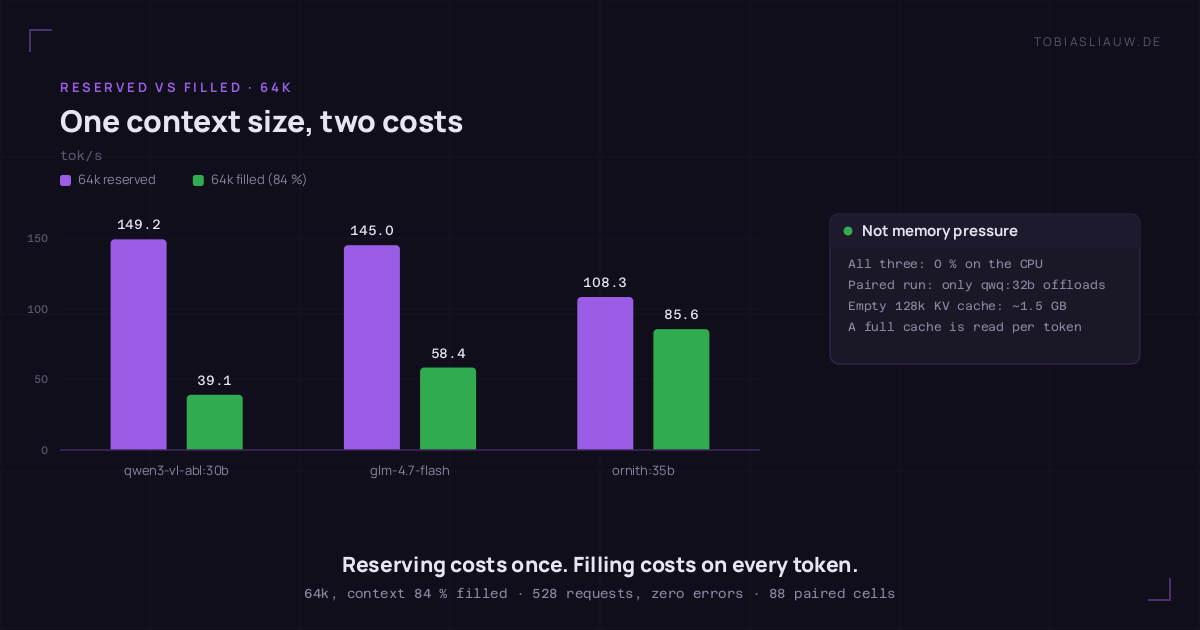
I set out to answer one question: what does long context actually cost on a 24 GB card? I ran it on two machines and got two answers that flatly contradict each other. On the first, going from 8k to 128k cost nothing at all. On the second, the same jump cost two thirds of it.
Both measurements are correct. The difference was in my own method, and finding it was worth more than either number. Reserving context and filling it are two entirely different costs, and almost every benchmark I have seen — including my own earlier one — quietly measures the first while sounding like it measured the second.
Machine one: reserving 128k is nearly free
Four runs over twelve models on an RTX 3090 in a workstation: 8,192 tokens, 32,768, 65,536, then each model’s own ceiling. Ollama 0.32.5, driver 610.88, KV cache q8_0, flash attention on, temperature 0, three seeds per task. Medians recomputed from the per-request log, generations of 50 tokens or more.
Corrected on 2026-08-02: the three runs stand, the reasoning does not. Measured on both hosts, ornith:35b and qwen3.6:27b return byte-identical output across all three seeds — there the seed changes nothing at all. qwq:32b, gemma4:26b, qwen3:8b and deepseek-r1:14b, by contrast, produce different output from an identical seed. Three seeds therefore catch variance where variance exists, but they do not test the effect of the seed. The measurements are unaffected — only this justification is.
Addendum of 2026-08-03: “from an identical seed” is put too loosely. Re-measured, exactly one run per group differs — always the first, in 111 cases out of 111. Every later run is byte-identical to the others, across both machines as well (108 of 108 cell pairs). Five different seeds produce the same text as five repetitions of one seed: the seed has no effect, the position does. The measurements are unaffected.
The tasks are short. One-sentence reasoning questions, a few coding prompts. So num_ctx was set to 131,072 and then perhaps 300 tokens of it were ever occupied.
Seven of the twelve held that reservation entirely in VRAM and lost nothing measurable:
| Model | Ceiling | 8k | At ceiling | Change | VRAM needed |
|---|---|---|---|---|---|
| glm-4.7-flash | 131,072 | 124.9 | 124.4 | −0.4 % | 21.40 GB |
| ornith:35b | 131,072 | 118.5 | 122.8 | +3.7 % | 21.25 GB |
| gemma4:26b | 131,072 | 102.6 | 104.7 | +2.0 % | 16.60 GB |
| deepseek-r1:14b | 131,072 | 68.1 | 68.0 | −0.2 % | 21.37 GB |
| qwen3.6:27b | 131,072 | 39.2 | 39.1 | −0.3 % | 20.03 GB |
| qwen2.5vl:7b | 128,000 | 120.8 | 124.5 | +3.1 % | 9.39 GB |
| qwen3:8b | 40,960 | 116.1 | 118.4 | +2.0 % | 8.05 GB |
The reason sits in the VRAM column. ornith:35b is 19.71 GB of weights and occupies 21.25 GB with 131,072 tokens reserved. An empty 128k KV cache costs about 1.5 GB. Grouped-query attention with a q8_0 cache makes the reservation itself almost weightless — the “context eats VRAM proportionally” rule of thumb is wrong for this generation of models.
The one thing that did cost, and cost brutally
The other five models needed more than the card had, so Ollama moved part of each onto the CPU.
| Model | 8k | At ceiling | Change | On CPU | VRAM needed |
|---|---|---|---|---|---|
| laguna-xs-2.1 | 141.0 | 115.2 | −18.3 % | 3.7 % | 19.74 GB |
| qwen3-coder-abliterated:30b | 149.4 | 79.5 | −46.7 % | 10.3 % | 24.18 GB |
| qwen3-vl-abliterated:30b | 141.4 | 61.1 | −56.7 % | 14.3 % | 24.59 GB |
| qwq:32b | 35.2 | 13.0 | −63.1 % | 11.2 % | 24.18 GB |
| devstral:24b | 48.4 | 13.1 | −72.9 % | 13.9 % | 25.18 GB |
Line the CPU share up against the loss and the ratio barely moves: 3.7 % → 18.3 % (factor 4.9), 10.3 % → 46.7 % (4.5), 11.2 % → 63.1 % (5.6), 13.9 % → 72.9 % (5.2), 14.3 % → 56.7 % (4.0).
A single-digit CPU share is not “slightly slower”. It halves your throughput. Which makes that sizing rule binary: either the whole model sits in VRAM, or it is the wrong model for that context length. Ollama runs the degraded configuration without comment unless you ask /api/ps.
One model refuses to fit the story. laguna-xs-2.1 offloads 3.7 % while needing only 19.74 GB in total, comfortably inside the card. I have no explanation and will not invent one. Until that is understood, treat the roughly 21.5 GB threshold as a rule of thumb rather than a guarantee — everything up to 21.40 GB ran clean, everything from 24.18 GB up offloaded, and there is no measurement in between.
The paired run: both machines, both conditions
The first version of this post leaned on two sweeps that were not directly comparable. So I ran it properly: the same harness on both machines, eleven models with byte-identical digests, four context sizes, and at each size both conditions — context merely reserved, and context filled to 84 %. Three seeds, generation length fixed at 300 tokens. 528 requests, zero errors, and the prompt token counts came out identical on both hosts across all 88 cells, which is what makes the comparison paired rather than merely parallel.
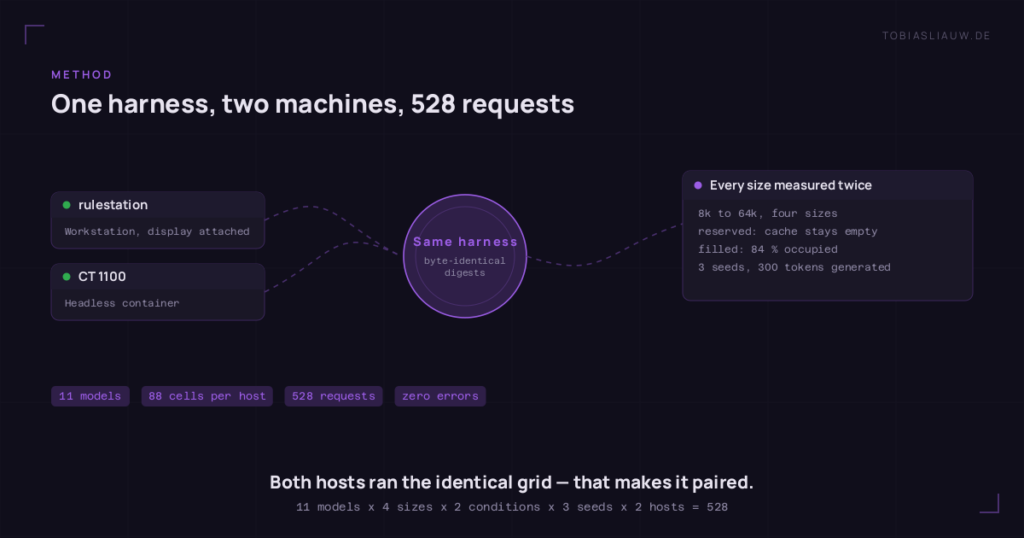
Generation throughput in tokens per second, reserved on the left, filled on the right:
| Model | 8k res. | 64k res. | 8k full | 64k full | Change when full | On CPU |
|---|---|---|---|---|---|---|
| qwen3-vl-abliterated:30b | 153.6 | 149.2 | 113.4 | 39.1 | −65.5 % | 0 % |
| deepseek-r1:14b | 69.5 | 69.2 | 57.9 | 25.7 | −55.6 % | 0 % |
| glm-4.7-flash | 146.1 | 145.0 | 113.2 | 58.4 | −48.4 % | 0 % |
| qwen2.5vl:7b | 136.2 | 133.6 | 111.5 | 59.6 | −46.5 % | 0 % |
| laguna-xs-2.1 | 145.6 | 144.9 | 130.6 | 78.4 | −39.9 % | 0 % |
| qwen3:8b | 137.2 | 134.0 | 104.3 | 77.5 | −25.7 % | 0 % |
| devstral:24b | 54.9 | 54.7 | 51.1 | 42.3 | −17.3 % | 0 % |
| qwen3.6:27b | 41.6 | 40.9 | 37.9 | 31.7 | −16.4 % | 0 % |
| gemma4:26b | 98.3 | 98.3 | 83.5 | 74.3 | −11.0 % | 0 % |
| ornith:35b | 107.1 | 108.3 | 94.7 | 85.6 | −9.6 % | 0 % |
| qwq:32b | 36.2 | 13.4 | 31.5 | 3.4 | −89.3 % | 11.2 % |
The reserved columns are a straight line. The filled columns fall on every single model, on both machines. And look at the last column: only qwq:32b offloaded anything at all. The other ten ran entirely in VRAM at every size and still lost up to two thirds of their speed. That settles the mechanism — this is the cost of attending over a full cache, not memory pressure.
qwq:32b is excluded because it offloads and therefore measures a different effect.One pattern worth noting: the models that lose least were already the slowest. devstral and qwen3.6 give up only 16–17 %, but they start at 55 and 42 tok/s. The fast mixture-of-experts models pay hardest — qwen3-vl-abliterated falls from 153.6 to 39.1.
A side finding: your monitor costs you 1.8 GB
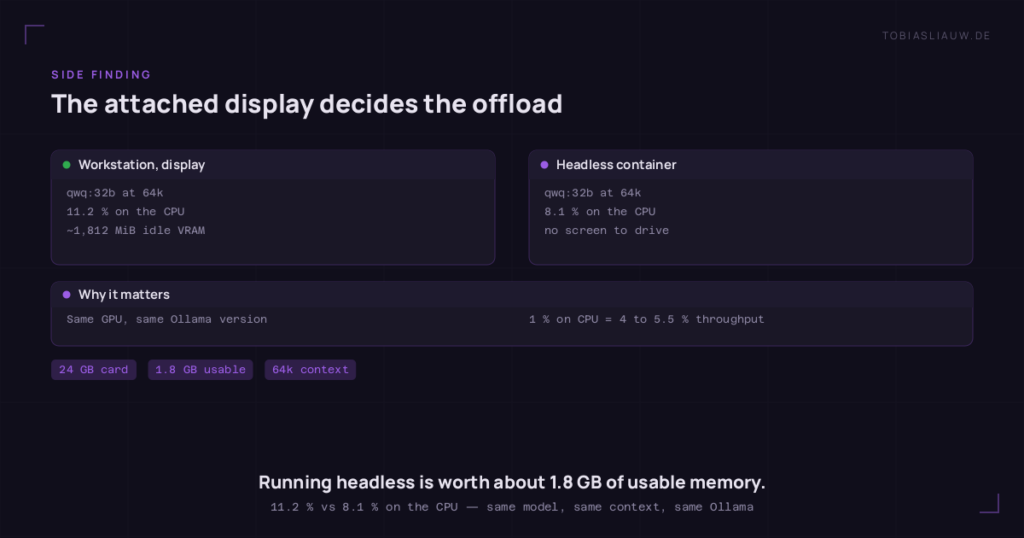
The two machines are the same GPU. One is a workstation with a display attached, the other a headless container. At 64k, qwq:32b offloaded 11.2 % on the workstation but only 8.1 % on the headless box — same model, same context, same Ollama version.
The workstation idles at roughly 1,812 MiB of VRAM because something has to drive the screen. On a 24 GB card running a model near the limit, that is exactly the margin that decides whether you offload. If you are squeezing a large model onto a single card, running it headless is worth about 1.8 GB of usable memory — and given the four-to-five times amplification above, that can be the difference between full and half throughput.
Why both results are true
Reserving context allocates a KV cache. That is a memory cost, it is paid once, and thanks to GQA and q8_0 quantisation it is small — the 1.5 GB above.
Filling context puts tokens in that cache, and every subsequent generated token has to attend over all of them. That is a bandwidth cost, and it is paid on every single token. An empty 128k cache is 1.5 GB of untouched memory. A full one is 1.5 GB that has to be read for each token you generate.
So the two experiments answer two different questions, and only one of them is the question people actually mean:
- “Can I set
num_ctxto 128k without paying for it?” Mostly yes, if the model stays in VRAM. That is the first table. - “What happens when I actually use a 128k conversation?” You lose a quarter to seventy percent of your speed, offloading or not. That is the second.
The two effects also stack. A model that offloads and runs a full context pays both.
What this corrects
An earlier post of mine reported that seven of eight models held 64k in VRAM and lost 11 % to 39 % doing it. That sweep also used short prompts, so its losses cannot have come from context occupancy either — and this wider sweep on a newer Ollama shows no loss at all under the same conditions. I no longer trust that 11–39 % figure, and I am not able to reproduce it.
The first draft of this post was worse. It had only the first machine’s data and concluded that “context is nearly free, only offloading costs”. That reads as an answer to the second question while being an answer to the first. The second machine caught it before publication, which is the entire argument for running the same thing twice on different hardware.
What to take away
- Ask any context benchmark whether the context was filled. If the prompts are short, it measured allocation, not use. That includes most of the ones you will find, and it included mine.
- Budget VRAM generously but time conservatively. The cache is cheap to reserve and expensive to read.
- Treat any CPU offload as a failed configuration. Four to five times amplification means there is no acceptable small amount.
- Verify the ceiling. Ollama clamps
num_ctxat the model maximum silently — two of twelve models here ran far below what the request asked for. - Probe, do not compute.
gemma4alone has an emptyhead_count_kv, split SWA and global key lengths and a separate vision tower. Every formula I tried mishandles at least one model.
Still open: where the offload threshold really sits between 21.4 and 24.2 GB, why laguna offloads at 19.7, and the fill sweep at 25 % and 100 % occupancy rather than only 50 %. All three need measurements, not arguments.