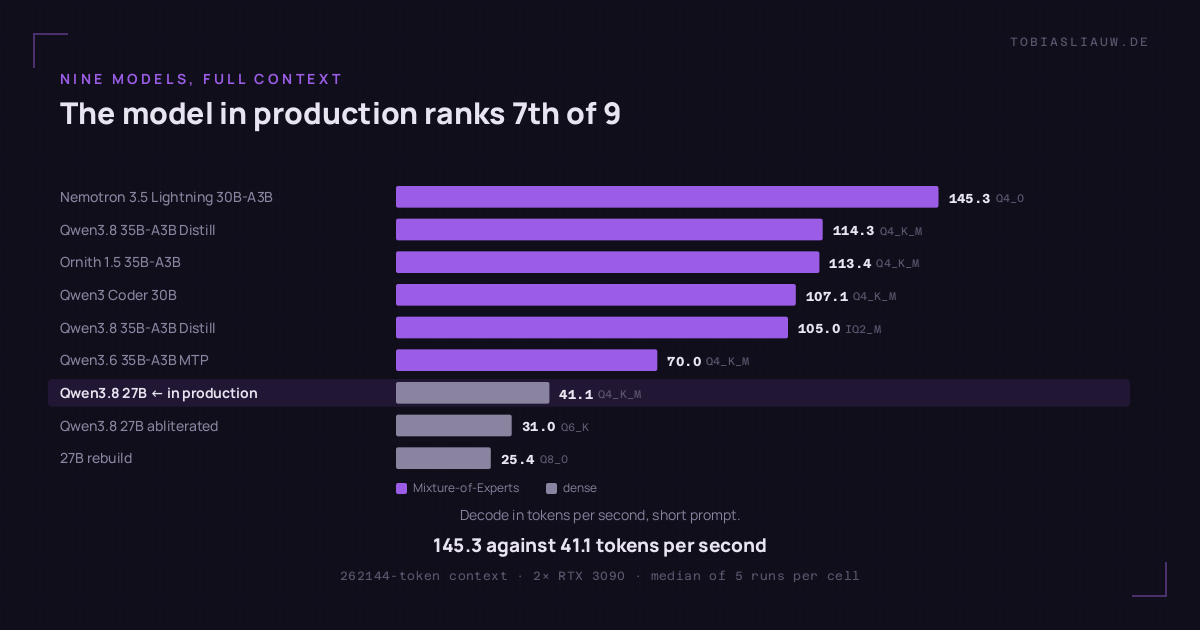
Nine local models, three prompt lengths, reasoning on and off, all at a 262144-token context on two RTX 3090s — and the model that has been doing the work here for weeks comes in 7th of 9. The fastest in the field returns 145.3 against 41.1 tokens per second and uses 4.7 GB less memory doing it.
That is the table. The more interesting part of this text is what broke when the table was checked — including one explanation I first declared refuted and which turned out to be right.
Speed is the wrong single axis here
The model leading at 145.3 tokens/s failed the tool probe the night before this run: tools FAIL 1/3, annotated [DECLARED_NOT_DELIVERED] — it advertises tool capability and does not deliver it. The same night it also failed reasoning and coding, the latter with the remarkably precise verdict OK_model_ran_and_was_wrong.
A caveat belongs here, because it corrects my first draft of this paragraph: the production model could not be cross-checked on the same night — the probe skipped it at a memory gate triggered by its own running server. Its last passing tool result comes from an earlier run. I had originally written “passes 3/3”; that row belonged to a similarly-named bench twin, not to the production model.
One contradiction stays open and is not resolved here: the same probe also marked the leader’s reasoning chain FAIL_BROKEN — while this run measured reasoning blocks of 3135 to 4593 characters for that same model, on three of three calls. One of the two measurements is testing something other than the other. Which one, I do not know.
The re-run that changed nothing
On 18 September a smaller version of this table existed: five models. Every cell had been produced under 39 to 72 % foreign load — the same cards were still running a production chat service and the embeddings for a knowledge base. Reason enough to treat the numbers as spoiled and repeat everything with exclusive access.
The result across 30 directly comparable cells: median deviation +0.0 %, range −5.9 % to +8.8 %. No model moved by more than a tenth, and the signs scatter randomly.
The explanation I have for that does not come from this run, and that difference matters. An earlier concurrency test had shown the model server processes requests for the same model serially — eight simultaneous requests cost eight times the wait at flat throughput. If that holds, your own request has the cards to itself anyway, and the utilisation gauge is reporting the other request ahead of it rather than simultaneous competition. This run is consistent with that explanation but cannot establish it: it ran behind a block that had removed foreign traffic entirely. You cannot measure concurrency by switching it off.
What foreign load does cost
The first attempt failed, and it failed informatively. The server’s load lines across those four minutes:
08:11:44  offloaded 65/65 layers to GPU
08:12:22  offloaded 66/66 layers to GPU
08:13:45  offloaded 65/65 layers to GPU
08:14:07  offloaded 66/66 layers to GPU
08:14:37  offloaded 65/65 layers to GPU
08:15:04  offloaded 66/66 layers to GPU
65 layers is the candidate, 66 the fleet default. Benchmark and live traffic were evicting each other in turn — on average every 40 seconds, with individual gaps between 22 and 83. Each swap is a full load. Without the load-time gate that would have become a plausible table measuring load times with “throughput” written on top.
Between 05:00 and 09:00 the non-localhost request rate sat at 1 to 13 requests per minute. Idle minutes do exist — 21 to 28 out of 60 depending on the hour — but no gap long enough to fit a model swap and a measurement into. So foreign load does not spoil the number; it prevents you from getting one.
The numbers
Decode in tokens per second, median of five runs per cell (three with the reasoning chain on). Occupancy measured across both cards with nvidia-smi rather than taken from the server’s self-report — why, below.
| Model | File | Used | short ~41 tok |
medium 1079–1334 |
long 4373–5464 |
Prefill long |
Load |
|---|---|---|---|---|---|---|---|
| Nemotron 3.5 Lightning 30B-A3B (Q4_0) | 17.6 | 27.65 | 145.3 | 143.7 | 138.6 | 5875 | 14.8 s |
| Qwen3.8 35B-A3B Distill (Q4_K_M) | 21.6 | 29.12 | 114.3 | crash | 118.4 | 4732 | 39.3 s |
| Ornith 1.5 35B-A3B (Q4_K_M) | 21.5 | 29.12 | 113.4 | crash | 118.2 | 4668 | 17.0 s |
| Qwen3 Coder 30B (Q4_K_M) | 17.3 | 35.62 | 107.1 | 116.6 | 96.1 | 7766* | 32.6 s |
| Qwen3.8 35B-A3B Distill (IQ2_M) | 12.5 | 24.59 | 105.0 | 112.8 | 107.3 | 4026 | 26.1 s |
| Qwen3.6 35B-A3B MTP (Q4_K_M) | 21.4 | 32.48 | 70.0 | crash | 77.2 | 3193 | 20.3 s |
| Qwen3.8 27B (Q4_K_M) — in production | 16.5 | 32.39 | 41.1 | 45.1 | 50.0 | 1141 | 37.7 s |
| Qwen3.8 27B abliterated (Q6_K) | 20.9 | 33.09 | 31.0 | 30.8 | 30.1 | 1633 | 38.4 s |
| 27B rebuild (Q8_0) | 28.6 | 39.96 | 25.4 | 24.9 | 24.6 | 1883 | 49.4 s |
* Prompt lengths differ per model because each tokenises the identical filler text differently. The coder reads 5464 rather than 4373 tokens in the long case — so its 7766 tokens/s is measured on a 25 % longer prompt and is not directly comparable with the other rows.
Dense versus mixture-of-experts is the whole story. The three slowest places are occupied by exactly the three dense 27B models — 41.1, 31.0 and 25.4 tokens/s. Every MoE in the field returns at least 70. That is not a narrow lead, it is a different order of magnitude, and it holds at all three prompt lengths.
One caveat that gets its explanation further down: the two models running speculative decoding are precisely the anchors of this comparison — the fastest dense row (41.1) and the slowest MoE (70.0). Both are therefore measured faster than they would otherwise be. The dense/MoE gap is, if anything, understated.
More bits cost twice here — with a caveat. The three dense 27B rows in Q4_K_M, Q6_K and Q8_0 return 41.1 → 31.0 → 25.4 tokens/s at 32.39 → 33.09 → 39.96 GiB. That looks like a clean quantisation ladder and is not one: these are three different models. The Q4_K_M row additionally carries a vision tower and is the only one of the three running speculative decoding, the Q6_K row has modified weights, the Q8_0 row is a third-party rebuild. The direction is plausible; a controlled experiment it is not.
The Q8_0 variant is the slowest model in the field, occupies the most and takes longest to load — the worst choice on every dimension except prefill, where its 1883 tokens/s still makes 7th of nine.
Prefill and decode rank differently. The coder ingests fastest but decodes slower than Nemotron — and on a long prompt slower than on a medium one. A single “tokens/s” figure hides that.
The explanation that died and came back
For six of the nine models the reasoning chain barely changes throughput; deviations run from −1.6 to +6.3 %. A seventh, the coder, was never actually treated: it emitted zero reasoning characters in all three reasoning-on cells — the switch does not take on it. Two stand out:
- the model in production: 41.1 → 48.7 · 45.1 → 55.8 · 50.0 → 57.1 (+14 to +24 %)
- the previous generation’s MTP build: 70.0 → 85.3 and 77.2 → 84.9 (+10 to +22 %; the medium cell is missing because it crashes)
Comparing the memory figures, the gap between the server’s self-report and the measurement at the card is not constant: for seven models it sits between 0.60 and 1.46 GiB, for the production model at 7.87 and for the MTP build at 5.45 GiB. Precisely the two models with several unattributed gigabytes are precisely the two with the speed-up. A co-loaded draft model for speculative decoding would explain both at once.
I searched the journal, found two lines — no implementations specified for speculative decoding and draft: 0.000 MiB — and declared the explanation refuted. The paragraph was already written.
Both lines came from a different model’s load. My time window covered several loads and I had not checked which one the hits belonged to. For the two models in question the journal says the opposite:
--spec-type draft-mtp --spec-draft-n-max 4 --spec-draft-backend-sampling
[spec] estimated memory usage of MTP context is 2250.06 MiB
draft acceptance = 0.57143 (4 accepted / 7 generated), mean len = 2.33
Speculative decoding runs on exactly those two models and on none of the other seven — at a draft depth of 4 on the production model and 2 on the MTP build. Acceptance rates measured across the run: 29 to 67 % on the production model, 56 to 81 % on the MTP build. And the gap now has names: 4.24 GiB of compute buffer (2169 MiB per card), 2.20 GiB of draft context and 1.13 GiB of vision tower — three items the runtime query omits entirely. They sum to 7.57 of the 7.87 GiB. I would not over-read how neatly that lands: the journal prints two of the three as estimated, and it does not say whether they overlap.
The original hypothesis was right. What was wrong was my refutation of it.
Where the server’s self-report is wrong
For the production model the runtime query reports 24.52 GiB while the cards show 32.39 GiB. The difference is the compute buffer (2169 MiB per card, 4.24 GiB together), the draft context of speculative decoding (2250 MiB) and the vision tower (1161 MiB). None of it appears in the query.
Practical consequence: plan VRAM from the card, not from the service. A flat surcharge does not help, because the error ranges from 0.60 to 7.87 GiB depending on which of these extras a model brings along.
The compute buffer is paid for twice when you split
A note on measurement basis first: this section works from the server journal’s line items, not from the nvidia-smi measurement in the table. The two bases sit about one and a half gigabytes apart, because the card also sees things the journal does not itemise.
At full context the most conspicuous item is neither the weights nor the context cache but the compute buffer — and it is allocated per card. For the smallest model in the field: weights 10900 MiB, context cache 2720 MiB, compute buffer 4881 MiB twice.
That makes the compute buffer almost as large as the weights, and half of it exists only because the model runs split. For this model the context cache is the smallest item — all nine run with --cache-type-k q8_0 --cache-type-v q8_0, which compresses it. That does not hold for the three dense 27B rows, where it is the second-largest.
This corrects a claim that was a heading in my first draft: “At full context, not one model fits on a single card.” It compared a two-card total against a one-card limit. Whether any of these models fits on one card is not something this measurement answers — that would require loading one with a single card, which I did not do. Arithmetic only goes so far here: in this setup the second card is not empty anyway, it carries the embedding model.
Three models reproducibly lose a cell
The three Q4_K_M builds of the 35B-A3B architecture each fail the “medium” cell five times out of five. Not on the same fault: two die on CUDA error: an internal operation failed, the MTP build on CUDA error: an illegal memory access was encountered. Same cell, same rate, different cause — which weakens the “one crash, one reason” framing. The same models deliver cleanly at a shorter and at a longer prompt.
The comparison this field provides: the same base distill in IQ2_M completes all six cells — five of five without the reasoning chain, three of three with. Same architecture, same expert count, same declared context length, different quantisation, no crash.
The obvious explanation would be the MTP tensors the loader reports as unused in two of the three crashing builds — the third, the MTP build itself, actually uses them. That does not hold either: the same metadata entry is in the working IQ2_M build. What remains is a reproducible crash with a clean counter-example and no cause.
Six gates, and what actually fired
A harness that can only pass tests nothing. Every measurement ran against six conditions: load time ≥ 1 s, stopped on the length limit, empty answer, not fully on the card, embedding model not answering, foreign load above threshold.
Exactly one of them fired: the load-time gate, in three cells. Three further cells dropped out earlier, through the harness’s exception path, because the server had crashed — that is not a gate, that is the route past them. My first draft said “three gates” and confused exceptions with gates. The other five gates never fired in this run; whether they work is therefore unproven.
Three details that each cost half a day:
Throughput is never read out of the log. The obvious pattern for the evaluation timing also matches the prompt-evaluation line, and reported 38.8 tokens/s for a model the API path measures at 109.8. The figures come from the counter fields in the response.
Every prompt carries a random nonce. A repeated prompt hits the cache and drives measured prompt speed up many-fold.
A block you set but never verify is an assumption. For exclusive access, three known services were shut out first. The control fired: the request rate did not drop. At the time I took that for a fourth, unknown service. What the record actually shows is weaker and more uncomfortable: the requests getting through carried an address that was already on the block list. Whether a second service sat on that same host, or the block simply did not take, I never separated. The lesson stands, only stricter: an enumeration of clients is only as good as the last inventory — and a block whose effect you do not verify per address is not a block. The rule now blocks everything non-local.
One caveat that honesty requires: two of the nine rows — the production model and the abliterated variant — come from the first attempt and still ran under the older, incomplete three-address block. Their recorded foreign load peaked at 10 %, so no contamination is visible; they were nonetheless not re-measured under the final rule.
What I take from it
The repetition was right, just not for the reason I ordered it. It did not correct the old numbers, it confirmed them — turning a measurement with an asterisk into one that holds.
The most instructive part is further up and happened to me: an explanation that sounded too good, killed with two journal lines, without checking which model they belonged to. A time-window search across several loads returns hits that look like an answer. The explanation was right; my refutation was a careless error with a log quote attached. Scepticism towards your own hypothesis is good — scepticism that goes unchecked itself is just faster at being wrong.
And the most expensive lesson is not about models: I spent two hours removing a contamination that was not there, because I had taken a utilisation gauge for a measure of contention. The number was real. My reading of it was not.
None of this makes the switch of production model due, and that is not about throughput: the fastest candidate fails tool calling, reasoning and coding. What is measured here is one dimension of several — and not the most important one. 145 against 41 tokens per second is a strong argument; it becomes a reason only alongside a quality measurement on the work that actually turns up. That is the next piece.