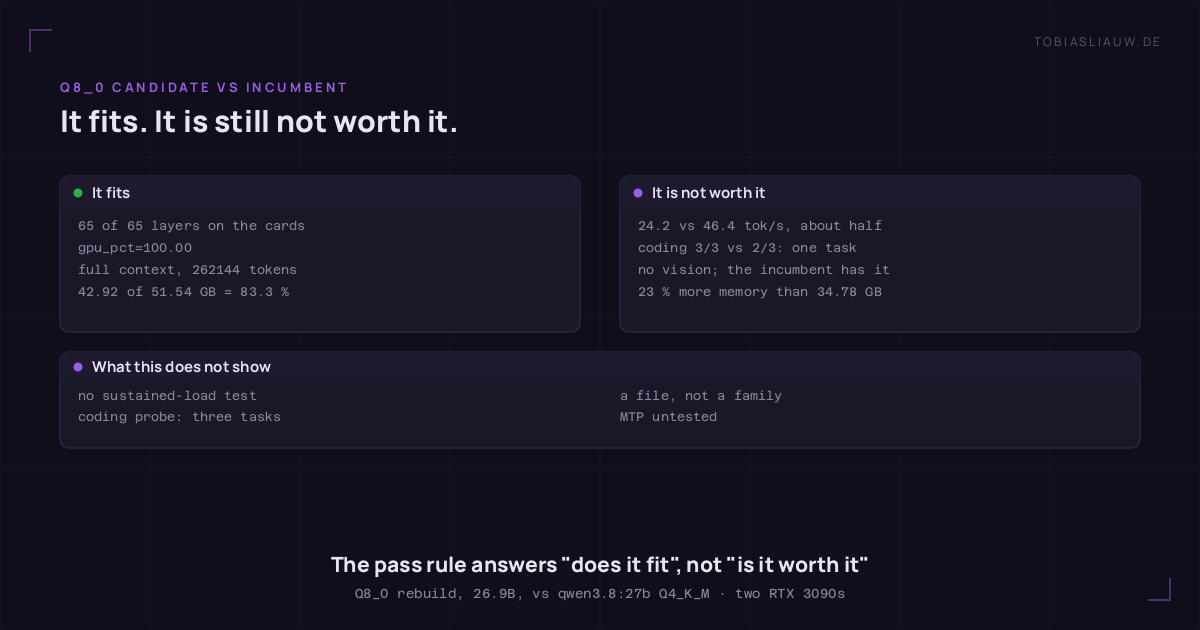
The candidate passed. The pass rule was written down before the run, and it met that rule cleanly: 65 of 65 layers on the cards, gpu_pct=100.00. It still replaces nothing. What sits between “it fits” and “it is worth running” is mainly half the throughput — and 23 % more memory, measured with nvidia-smi after this line first said 60 %.
The candidate — a third-party Q8_0 rebuild with 26.9B parameters — runs entirely on two RTX 3090s at the full 262144-token context, occupies a measured 42.92 GB doing it, and returns 24.2 tok/s against the incumbent’s 46.4 tok/s.
That refutes the assumption I had been carrying: that a Q8_0 this size cannot hold a full context on two cards. It can. Only “does it fit” and “is it worth it” have different answers here.
“Pass” was defined before the run, not after
A model that answers does not prove it is on the card. It proves that it answers. So the rule was written down before the run, and it has two arms: the journal must report offloaded N/N layers, the runtime query must return gpu_pct=100. Not “it did not crash”. Not a tok/s number you like afterwards.
The candidate satisfies both arms: 65 of 65 layers, gpu_pct=100.00. So does the incumbent, with 66 of 66. Loading takes 54.1 s against 10.6 s — but load time was never part of the rule, and I am not adding it now because it suits me.
What fits on two cards, and what it takes of them
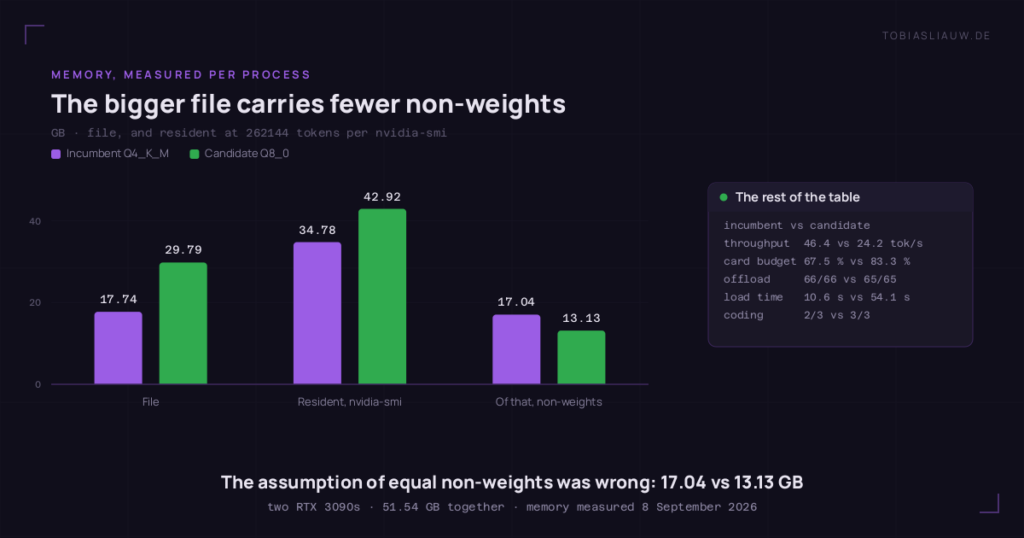
Two RTX 3090s hold 24576 MiB each, 49152 MiB together, 51.54 GB. The incumbent settles in at 34.78 GB, measured as 33172 MiB across both cards, 67.5 % of the budget. The candidate takes 42.92 GB — 40935 MiB — and that is 83.3 %. About 8.6 GB stay free against the incumbent’s 16.8 GB: neither leaves room for a second model of this class, so the gap is smaller than what I first wrote here.
An addendum before you carry those shares anywhere: a warning used to sit here, because further down is a third number that did not fit them — in the failed first run the incumbent’s process held 33214 MiB, more than the 26.33 GB in the table. I have measured since, and the third number was right: nvidia-smi attributes 33172 MiB to the incumbent, so the runtime query was off by 8.45 GB. On the candidate the same query was off by only 0.66 GB, by 0.67 GB at a quarter of that context, and on the co-resident embedding model by 0.83 GB — the error is not constant, so a flat surcharge would not have saved it. The percentages here therefore use 34.78 and 42.92 GB, both read off the cards; what was wrong is that query’s memory accounting, not its report of where the layers sit. That does not settle everything: the free-memory line further down counts every neighbour on the cards, this measurement counts only the one process.
Both ran with no num_ctx set, so both sat at their model maximum of 262144 tokens. The table values are from the second run — except the resident figure, the non-weights and the budget share: those three come from a separate measurement the next day, resolved per process with nvidia-smi so that neighbours on the cards do not count. “Non-weights” means nothing more than this: everything nvidia-smi attributes to the process beyond the file size. Why the first run produced no values at all is below.
| Metric | Incumbent Q4_K_M | Candidate Q8_0 |
|---|---|---|
| File | 17.74 GB | 29.79 GB |
| Resident at 262144 tokens — nvidia-smi | 34.78 GB | 42.92 GB |
| Of that, non-weights | 17.04 GB | 13.13 GB |
| Share of the card budget | 67.5 % | 83.3 % |
| Offload | 66/66 | 65/65 |
| Load time | 10.6 s | 54.1 s |
| Throughput | 46.4 tok/s | 24.2 tok/s |
| coding | 2/3 | 3/3 |
Half the throughput against a single point
24.2 tok/s against 46.4 tok/s. In the first run the incumbent showed 47.8 tok/s, so the magnitude holds. The honest version is the whole spread: across every run on that day and the next, the incumbent came in between 43.4 and 54.7 tok/s on an identical configuration. That puts the ratio to the candidate somewhere between 1.79 and 2.26. “Roughly half” survives the entire spread — and it survives because I give you the spread, not in spite of it. A single figure without its variance is a claim with a decimal point. None of it says how long an answer takes: load time and prefill are separate items, and what was measured is two runs of a few minutes.
One obvious explanation for the gap I measured and then discarded. The second card sits on eight lanes instead of sixteen, so half the bandwidth — 7.88 against 15.76 GB/s, confirmed under load and not an idle downclock. If that costs anything, it costs it while loading the weights. So I loaded the same model three times on each card, alternating, with the file cache warmed first so the SSD would not be measured instead: 8.44 s on the wide card, 8.85 s on the narrow one. A factor of 1.05. At half the bandwidth, 17.74 GB of weights should have differed by 1.13 s; the measured difference is 0.41 s. The halved link is real, and here it costs five percent.
I nearly turned that into “PCIe does not matter.” Then I remembered a measurement of my own from August that says the opposite: with a MoE model too large for one card’s memory, streaming its experts across the bus continuously, that same narrow card was 2.6 times slower than the wide one. And tensor parallelism across both cards was not faster than a single card but 3.5 to 5.2 times slower. Same slot, same cards, a different kind of load — and five percent becomes 260.
Both numbers are true. Mine holds for a dense model that sits entirely in the card’s memory and touches the bus only when loading. The other holds the moment every token has to cross it. A measurement without its scope is not a finding; it is a number waiting for its next victim. I had taken the second measurement myself and still came close to walking past it.
Against it stands one defensible advantage: coding, 3/3 instead of 2/3. One point on a probe with three tasks. Tools ends 3/3 to 3/3, and the candidate needed 5 s for it. That point does not weigh more because the repo name labels this rebuild a coder; the name is all I have. One task of difference is one task of difference.
The thinking probe carries no verdict
Same incumbent, same probe, eleven minutes between the two passes: PASS once, FAIL once — the failure going down a different arm than the candidate’s. Run 1: THINK_TRACE_CHARS 89, verdict PASS. Run 2: 98, verdict FAIL. The candidate: 32, verdict FAIL. The probe writes both failure arms into its report:
FAIL_ARM: content contains the trace verbatim => aliasing/no channel split
FAIL_ARM: trace 32 chars < 40 (gate open, resolver empty)
In all three cases the same probe reported THINK_ANSWER ok. The answer was right every time. What gets measured is trace length and substring overlap, not thinking. Here is the candidate’s complete trace, 32 characters and mathematically correct:
41 * 32 = 1312 1312 - 100 = 1212
The threshold is 40 characters. Compute it briefly and correctly and you fail — my probe rewards verbosity. That was never in the intent, only in the code. The other arm is no better: a short answer that carries its own working is indistinguishable from a trace that was never separated.
So the candidate’s FAIL does not count against it, and the incumbent’s PASS does not count for it. A probe that grades the same model two ways in eleven minutes is not grading the model.
The first run measured nothing about the candidate
In the first run the incumbent went first — it is also the model kept permanently resident in production. The bench unloads everything between two models, with one exception, and that one sits in the code as an intention, not in a config file:
UNLOAD_REFUSED: qwen3.8:27b is the production pin - left resident on purpose
Its process kept 33214 MiB. Preflight asks 32030 MiB for the candidate; loaded, the candidate takes 42.92 GB. What was left is in the log too:
only 13604 MiB free across all GPUs after 182s, needed 32030
per GPU: gpu0=7963 MiB gpu1=5641 MiB
After 182 seconds the bench gave up. The candidate never loaded, its five probes ended as SKIP, coverage across both models 40 %, exit 3. The bench releases the pin once during preflight — and then the first entry in its model list restores exactly the state the release was supposed to remove. A test rig that brings its own obstacle measures the obstacle.
The bad part is not the bench bug. It is the reading I had put on it earlier: the same numbers — 7963, 5641, 13604 — had been in front of me before, filed away as “the model is not being spread across both cards”. Nothing was ever spread. The predecessor never got out of the way.
Two unevenly filled cards and two unevenly vacated ones look identical in the output. The difference is not in the numbers, it is in the order of events before them — which I had not read. Run 2 only reversed the order, candidate first onto empty cards: coverage 80 %, exit 0, everything measured.
My prediction was not slightly off, it was wrongly reasoned
Before the run I had done the arithmetic: the KV cache hangs off layers and heads, not file size; same architecture, so the same non-weight share. For the incumbent the runtime query gave 26.33 minus 17.74, or 8.59 GB. Candidate: 29.79 plus 8.59, which is 38.38 GB.
Measured: 42.92 GB. The candidate’s non-weight share is 13.13 GB, the incumbent’s is 17.04 GB — against the old table the ranking flips, and my assumption that the two were equal was wrong either way. The prediction came out 11 % low; with the incumbent’s measured share it would have been 29.79 plus 17.04, or 46.83 GB and 9 % high. The reasoning was wrong end to end, and that is what stings: I assumed a constant where a variable stood, and I took it from a source that was off by 8.45 GB. A prediction that nearly holds on two errors is more dangerous than one that misses openly. It confirms you.
Two pieces of evidence that were none
Earlier that morning the candidate had already been built once. The build step copies 30 GB and prints the same line for minutes, “verifying conversion”, with a spinner. An earlier session looked in, concluded “dead”, and repaired it by hand.
The script then ran to the end on its own: CREATE_RC=0, LOAD_RC=0, offloaded 65/65. It cleaned up after itself and restored the starting state, production model included. “Failed” then sat in the notes as a fact, until somebody read the log. A running process without a progress display is not a dead one.
The second trap was in the checking. Run 1 ended with exit 3, and the service-state query disagreed with the system journal:
Result=success, ExecMainStatus=0
status=3, "Failed with result exit-code"
The run lived in a short-lived environment that cleans itself up. After that the status query no longer knows it, and answers an unknown job with plausible defaults instead of an error. A query that answers “never heard of it” the same way it answers “that worked” is worthless as evidence.
Watch it, do not adopt it
Of the five probes exactly one produces a difference that counts. The other four only look as if they do.
The vision probe fails on the candidate with an http-400. That is not a finding. The model lacks the capability — it reports tools, thinking and completion, and was built without the vision part. The incumbent has vision and passes. Blame a model for what it was never built to do and you measure your expectation, not the model.
The reasoning probe looks like a win: PASS for the candidate in 56 s, ERROR INCONCLUSIVE for the incumbent, in both runs. But that INCONCLUSIVE came from one of the three tasks being memorised. Another probe defect, not a model weakness. The thinking FAIL does not count either, and tools is a draw.
What is left: coding 3/3 instead of 2/3, against 24.2 versus 46.4 tok/s. Plus one condition that is not a probe verdict: the incumbent does vision and the candidate does not — a replacement has to do what the incumbent does. Memory only backs that up now: 23 % more, not the 60 % I had computed from the runtime query. Watch it, do not adopt it — on narrower grounds than I claimed when I first wrote this.
What this does not show
- No sustained-load test. Two runs of a few minutes each.
- The coding probe has three tasks. 3/3 against 2/3 is a difference of one task, not of class.
- A third-party Q8_0 rebuild says nothing about the base architecture. I measured a file, not a family.
- Multi-token prediction is untested. Almost every quant comes in an MTP and a non-MTP variant; I took the non-MTP one deliberately and never measured whether the runtime drives MTP or quietly falls back.
- The two probe defects are named, not fixed. While they stand, every statement these probes make about any model has to be read with care.
The setup, for anyone re-running this
Two runs of the same self-built bench on 7 September 2026, started eight minutes apart, under identical conditions: the cards were reserved exclusively for the bench. Five capability probes — thinking, reasoning, vision, coding, tools. Hardware: two RTX 3090s with 24576 MiB each, 49152 MiB or 51.54 GB together. Ollama as the runtime, KV cache type q8_0, flash attention on. The bench sends no num_ctx, so both ran at context_length 262144. The memory figures in the table come from a third measurement on 8 September 2026: both models at the same 262144 tokens, occupancy resolved per process with nvidia-smi, plus the candidate at 65536 tokens as a control.
Incumbent: qwen3.8:27b, Q4_K_M, 27.3B, file 17.74 GB, digest 22130167c4c2, capabilities completion, vision, tools, thinking. Candidate: the Q8_0 rebuild, 26.9B, file 29.79 GB, digest ab7447c5e7b1, capabilities tools, thinking, completion — no vision. From the upstream repo DavidAU/Qwen3.8-27B-TURBO-Fable-Cold-Fusion-735-882-Heretic-Uncensored-NEO-CODER-MAX-MTP-GGUF.
Watch the file: that repo holds a second Q8_0 at 30.24 GB, the MTP build. The only reliable difference is the byte count — mine has 29787699808. Candidate timings: reasoning 56 s, coding 31 s, tools 5 s. Run 1: incumbent first, coverage 40 %, exit 3, nothing measured on the candidate. Run 2: candidate first onto empty cards, coverage 80 %, exit 0.
And if you rebuild this: put the model your rig may not unload last in the model list — or release it and check the memory that is really free, not that the release ran.
What I take away
“It fits” and “it is worth it” are two questions, and a pass rule answers only the first. That is why I write it down beforehand: the candidate met it, cleanly and without help, and the decision still went against it. Without the rule I would have moved the bar afterwards — up when I like the result, down when I do not.
Every threshold in code is an unspoken claim about the world. Forty characters claim that nothing shorter counts as thinking. Thirty-two correctly calculated characters refute that.
The rest is three sentences I keep. An exception in test code eventually gets printed as a measurement; my first run was exactly that. A process without a progress display is not dead just because it is quiet. And a query that reports ignorance the same way it reports success is not evidence, it is a polite answer.