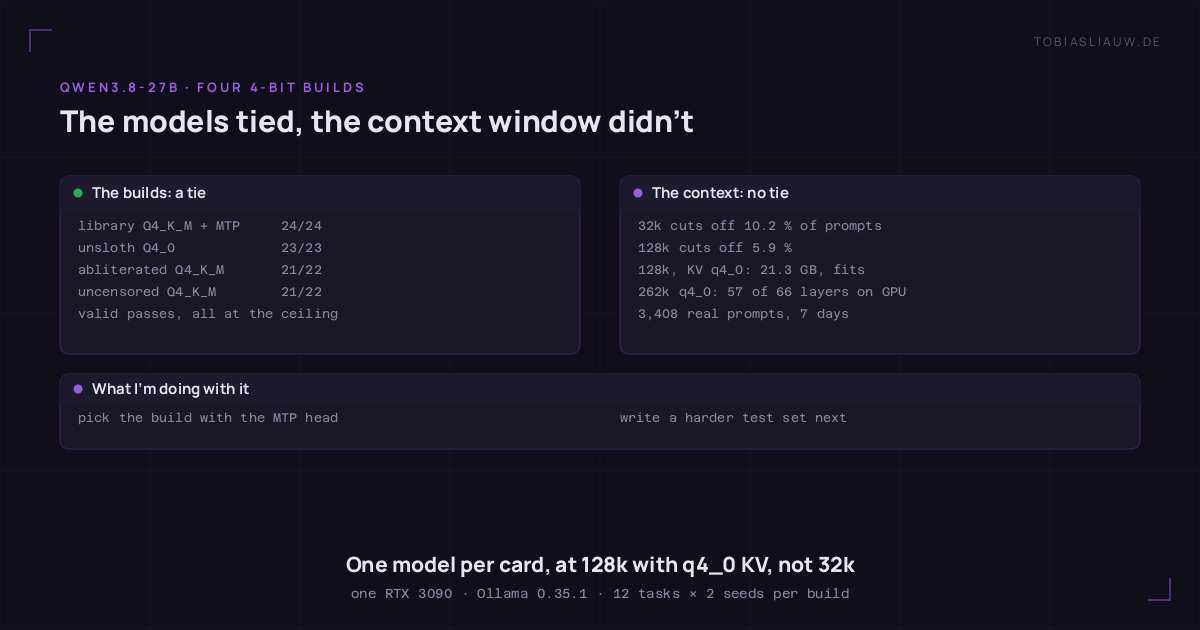
I wanted to split a dual-RTX-3090 box into “one model per card”: two independent 27B models instead of one model stretched across both GPUs at a huge context window. Before doing that, I wanted two answers. Which 4-bit build of Qwen3.8-27B should go on a card? And how much context does a single 24 GB card actually hold? The first question had a boring answer. The second one changed the plan.
The setup
- One RTX 3090 (24 GB), Ollama 0.35.1, a dedicated server instance pinned to that one card. Nothing else was allowed on the GPU while measuring. A gate checked for foreign processes before and after every request.
- KV cache
q4_0, flash attention on, context fixed at 32,768 tokens at the server level. Never per request; more on why below. - I verified every runner’s real flags (
-c 32768, KV type, flash attention, speculative decoding) on the process itself, not in a config file. - Identical sampling for every model (temperature 1.0, top_k 20, top_p 0.95), two seeds, a unique prompt per request, and every model warmed up before measuring.
- Twelve tasks: four reasoning tasks with exact answers, four coding tasks whose output is executed against a reference implementation, and four instruction-following tasks with programmatic checks.
- Every checker had to accept a known-good answer and reject a known-bad one before it was allowed to grade anything.
- A run that hit the token limit (6,144) or returned an empty answer counts as invalid, not as a failure. The limit is a property of my test, not a verdict on the model.
Finding 1: the four 4-bit builds tie, and the speed gap is packaging
| build | valid passes | invalid | generation tok/s | prompt tok/s | VRAM @32k |
|---|---|---|---|---|---|
Ollama library qwen3.8:27b (Q4_K_M, with MTP head + vision) | 24/24 | 0 | 43.5 | 1,056 | 18.6 GB |
| unsloth Q4_0 | 23/23 | 1 | 35.8 | 1,308 | 16.8 GB |
| community “abliterated” Q4_K_M | 21/22 | 2 | 32.6 | 1,222 | 16.4 GB |
| community “uncensored” Q4_K_M | 21/22 | 2 | 30.6 | 1,164 | 16.4 GB |
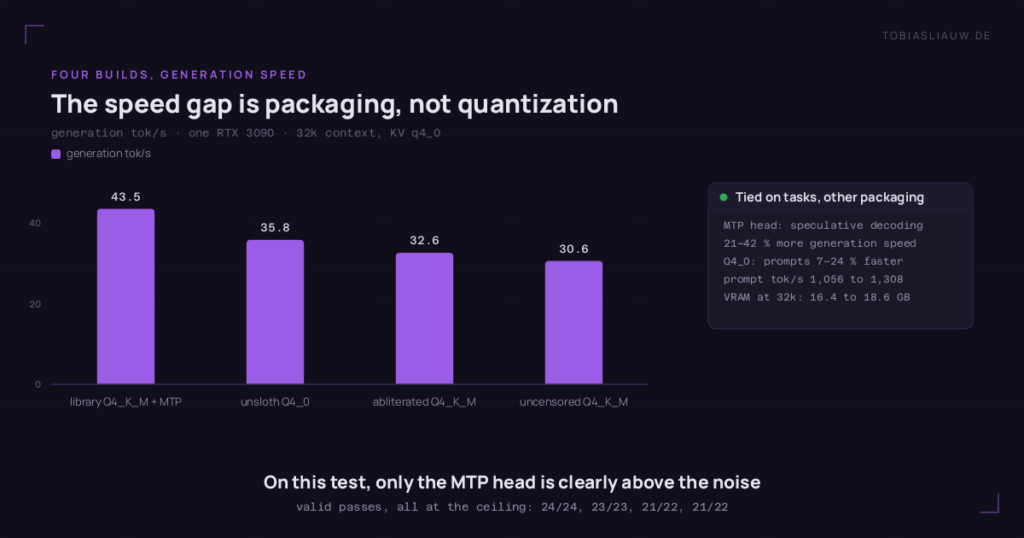
With 24 graded cells per model, one or two cells of difference mean nothing. These tasks are simply too easy to separate 27B models. All four sit at the ceiling. I can neither confirm nor rule out that the “uncensored” builds lose capability.
The robust differences are elsewhere:
- Speed comes from packaging, not quantization. The Ollama library build ships a multi-token-prediction (MTP) head and runs speculative decoding with it. That is worth 21–42 % more generation speed than the plain GGUFs. Q4_0 reads prompts 7–24 % faster than the Q4_K_M builds.
- The failures are interesting individually.
- Three of the five invalid runs were a calendar question (“what date is 1,000 days after 14 March 2027?”). The models thought for up to 13,000 characters and never answered.
- One code failure was a real bug: a Roman-numeral parser that rejected the letter “I”.
- One instruction failure is debatable. The answer had two sentences, but the second one had no full stop. My checker counts terminators. I did not re-grade it after the fact, because the checker was fixed before the run.
Finding 2: 32k context is not enough. I measured it on live traffic.
My plan assumed 32k per model. While the benchmark ran, the production server was temporarily limited to one card at 32k. I looked at what its clients had actually sent over the previous seven days (3,408 prompts):
| prompt longer than | share |
|---|---|
| 16k tokens | 21.0 % |
| 32k tokens | 10.2 % |
| 64k tokens | 8.0 % |
| 128k tokens | 5.9 % |
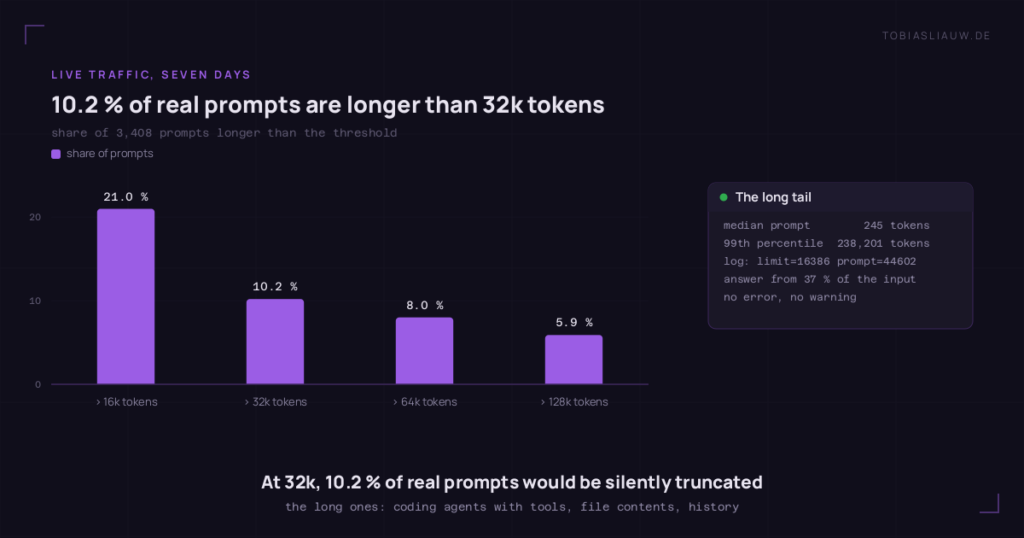
The median prompt is 245 tokens, but the 99th percentile is 238,201. Those long prompts are coding agents carrying tool definitions, file contents and history. Eight minutes after the switch, the log showed one of them: truncating input prompt limit=16386 prompt=44602. The client got an answer based on 37 % of what it had sent. It saw no error and no warning.
Finding 3: what one 24 GB card actually holds
The VRAM per context size was measured, one fresh server instance per configuration, for the 18.6 GB library build:
| context | KV q4_0 | KV q8_0 |
|---|---|---|
| 32k | ✅ 18.6 GB | ✅ 19.1 GB |
| 64k | ✅ 19.5 GB | ✅ 20.5 GB |
| 128k | ✅ 21.3 GB | ❌ 63 of 66 layers on GPU |
| 262k | ❌ 57 of 66 layers on GPU | ❌ 46 of 66 layers on GPU |
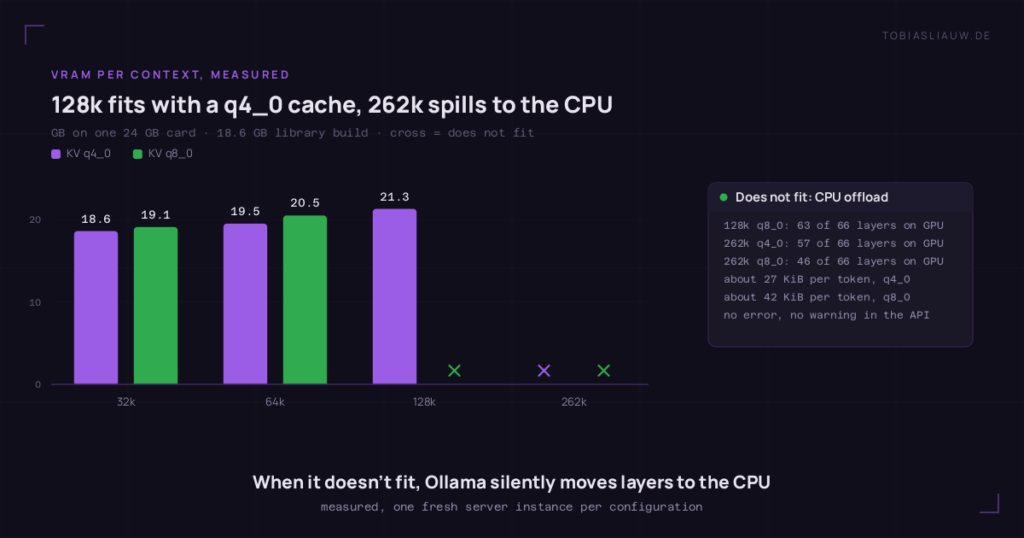
- The context cost is cheap and linear. About 27 KiB per token with q4_0, about 42 KiB with q8_0. This model family uses full attention in only a fraction of its layers, so the KV cache is far smaller than for a classic transformer of the same size. The linear model predicted the 262k miss before it was measured.
- 128k with q4_0 fits. By arithmetic it also fits on the second card, next to the embedding model that lives there (21.3 + 1.4 GB). That part is calculated, not measured on that card. It would cut off 5.9 % of real traffic instead of 10.2 %.
- Is a q4_0 KV cache still faithful at long context? One needle test: a code at the very start of a 101,482-token prompt, asked for at the end. It came back exactly. Prompt processing dropped to 779 tok/s at that length, but generation stayed at 43.2 tok/s, the same as with a short prompt. One needle is a positive signal, not a proof.
- When it doesn’t fit, Ollama does not fail. It silently moves layers to the CPU (the “57 of 66” above) and the model keeps answering, just slower. No error, no warning in the API. Only the offload line in the server log tells you.
Where Ollama itself bit me
Ollama 0.35 runs llama.cpp’s llama-server underneath, so the kernels and the speed are the same. The surprises all came from the orchestration layer around it:
- The default context follows the available VRAM, not my configuration. With 48 GB across two cards, Ollama loaded the model at 256k all by itself. Neither the model file nor my pin job asks for that. So unloading it would not have freed a card: the next client request would have loaded it straight back at 256k across both GPUs. That is why I moved the production instance to one card instead of just unloading the model.
- Prompts that are too long are silently truncated (Finding 2).
- A request whose
num_ctxdiffers from the loaded runner disappears. No error, no log line; the client just times out. That is why context is set at the server, never per request. - “Doesn’t fit” means “silently slower” (Finding 3).
For measuring, I will run llama-server directly from now on: explicit flags, loud failures, per-request timings, one model per process. For “what do my clients actually get”, Ollama stays in the loop.
My own measurement errors
- My idle check could never succeed. Before restarting the production server, I waited for the GPU to be idle, but I read utilization for the whole device. A virtual machine renders its desktop on that card, so the device was never idle. Worse, my script restarted anyway, because I had not made the restart depend on the check. The log shows no aborted request, but I cannot prove there was none. The fix: gate on the server process’s own utilization, and do not restart at all if it never goes quiet.
- My harness crashed on its own report. After the first model, the summary step tripped over the run’s metadata row. The measurements were already on disk, and I resumed from there. Reporting code is now no longer able to end a measurement loop.
What I’m doing with it
- One model per card stays the plan, but at 128k with q4_0 KV, not 32k.
- Pick the build with the MTP head. On this test, it is the only difference that is clearly larger than the noise.
- Write the next test set to be harder. A benchmark everything passes measures nothing.