On 21 October I wrote the GB10 off in this blog as a sidecar: 6.4 tokens per second per stream when four lanes run at once, chained to the 273 GB/s of LPDDR5X memory bandwidth — „useless for interactive work, a slow sidecar you nevertheless need”. On 31 October the same model ran on the same machine at 148.5 tokens per second, one day later at 145.2, and without a single harmless task refused. My verdict was right and my diagnosis was wrong: bandwidth was never the ceiling, the software stack underneath was — llama.cpp could load neither the NVFP4 weights nor the speculative draft (MTP) of that model variant, and those two things together are the factor of 12 to 20. This piece measures the new configuration: speed across session counts, how many 250-thousand-token windows actually run, what the half-precision key-value pool costs, why nothing fits next to it, and what all of this means per watt.
For the background: how the local fleet is built (auf Deutsch), the graphics-card patch (active on Atlas, not on the GB10), part 1 of the context series (what the KV cache costs) and part 2 (rope stretching). Every number here comes out of four measurement chains run on 31 October and 1 November 2026; the raw files are listed at the end.
Why I went back a second time
The GB10 is a machine with one single large memory: 121 GiB shared by CPU and GPU, attached at roughly 273 GB/s. llama.cpp sits there with a 79 GiB IQ3_S GGUF and does the arithmetic: 26.6 tokens per second on a short prompt, 9.6 at 128,000 to 192,000 tokens of context, 6.4 per stream with four lanes running. On top of that a speculative branch (MTP) that would not load — blk.48.nextn.hc_head_norm.weight not found — so no proposal checking at all. That was the state on 21 October, and bandwidth does explain it: a dense stream has to push several gigabytes per token through the head.
Early in November I ran into a recipe built for exactly this box: myllmbox/qwen38-flash-next-vllm, version 5.4. The point is not „a different program” but a different model variant in a different memory format: an NVFP4 checkpoint (4-bit experts, dense layers in MXFP8) that vLLM 0.32 understands natively, together with an MTP branch that runs there. Plus two things that matter enormously on a unified-memory machine: the huge state table of the linear part is served by mmap from NVMe rather than from DRAM, and a kernel fix (RecoverSSM) keeps the state values of the sequential layers out of the pool.
My pilot was deliberately narrow: no rebuild, the same machine, the same model, two stacks, measured with the same instrument I use on Atlas — read one document once, then 1,024-token turns, plus needle search, tool calls, strict JSON and a refusal set.
Finding 1: the factor sits between 5.6 and 13.1 — and it is not a pure engine effect
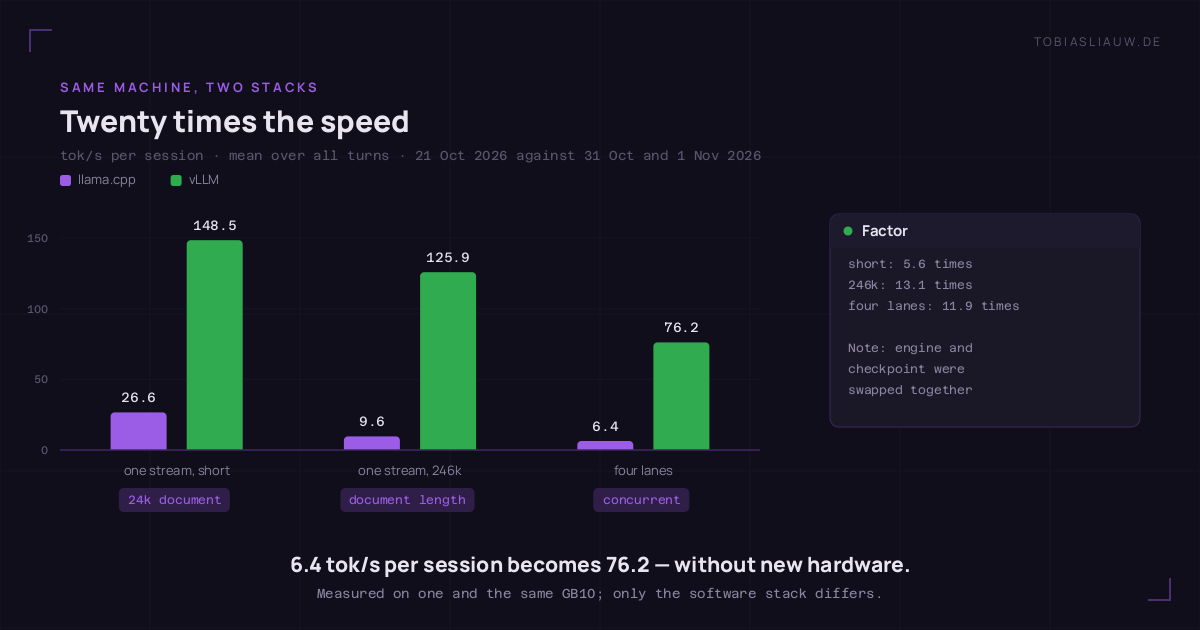
The honest framing before the number: I changed two things at once — engine and model variant. llama.cpp could not load the NVFP4 weights and could not verify the MTP branch; vLLM can do both. So this is not „engine A against engine B with the same model”, it is „the stack this machine could carry on 21 October against the stack it carries now”. But that is precisely the operationally relevant question: which speed do I get out of this hardware if I run the variant it was built for?
- One stream, short task: 26.6 → 148.5 tok/s (factor 5.6).
- One stream, 246,000-token document: 9.6 → 125.9 tok/s (factor 13.1) — and the whole answer in 129 seconds instead of more than a quarter of an hour.
- Four lanes at once: 6.4 → 76.2 tok/s per session (factor 11.9); eight lanes still give 47.2.
The internal confirmation that the proposal check really works: across all requests of the chain, 2.13 proposals were accepted per verification round, staged by depth: position 0 at 82 percent, position 1 at 68, position 2 at 55, position 3 at 8, position 4 and deeper at 0 percent. The practical depth is three to four proposals, not the nine that the recipe offers as a dynamic ceiling. A counter-test with a fixed depth of 4 gained nothing (2.11 accepted per round, −8 % in one configuration, +18 % in another, −8 % in a third), which is why the shipped setting stays.
| Configuration | llama.cpp (21 Oct) |
vLLM bf16 (31 Oct) |
vLLM fp8, roughly (1 Nov) |
|---|---|---|---|
| 1 session, agentic shape | 26.6 | 148.5 | 132.7 / 145.2 |
| 2 sessions | — | 97.0 | 101.3 / 112.0 |
| 3 sessions | — | — | 98.9 |
| 4 sessions | 6.4 | 76.2 | 74.9 |
| 8 sessions | — | 47.2 | — |
| first token, 1 session | — | 3.24 s | 1.45 s (turn) / 11.5 s incl. cold read |
| 250k document, 1 session | > 15 min | 129.1 s | — |
Finding 2: how many 250-thousand-token windows actually run, and where the cliff is
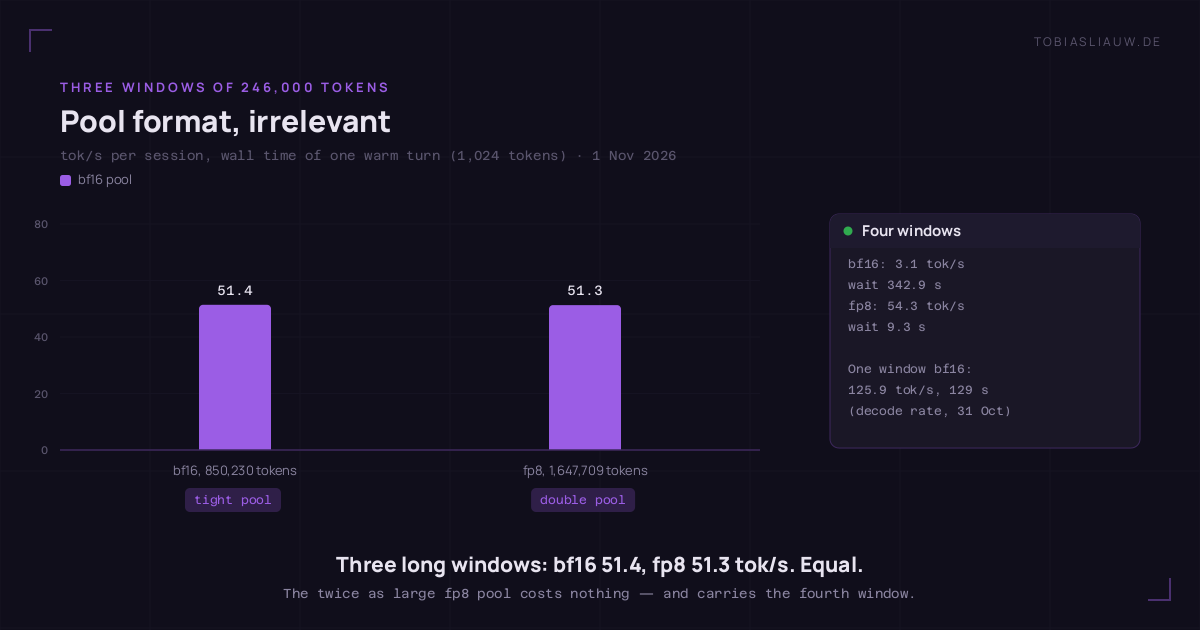
The service advertises a window of 409,600 tokens per request. What decides how many of those windows run concurrently is not the window but the key-value pool: the bf16 pool holds 850,230 tokens, the fp8 pool 1,647,709. Four windows of 246,000 tokens need 984,000.
- bf16, one window: 125.9 tok/s, 3.3 s to the first token, the whole answer in 129.1 s.
- bf16, two windows: 110.9 tok/s per session, 4.5 s to the first token.
- bf16, three windows: 101.8 tok/s per session, 6.4 s, 367.8 s per pass — still within reason.
- bf16, four windows: 3.1 tok/s, first token after 342.9 s, 1,380.5 s per pass. And the remarkable part: the service did not reject and did not evict anything —
num_preemptions_totalstayed at 0 the whole time. The fourth session simply stood in front of the admission gate and waited. - fp8, four windows: 54.3 tok/s per session, 9.26 s to the first token, 466.2 s per pass, 61 percent pool use.
The price of the fp8 pool, measured on the interactive shape (a 24,576-token document, then three turns): one session 148.5 → 132.7 tok/s (−11 percent), two sessions 97.0 → 101.3 (+4 percent), four sessions 76.2 → 74.9 (−2 percent). The field claim that fp8 costs „7 to 19 percent” therefore holds only for the bare single stream; from two sessions on it is level or better. Anyone who wants several long windows runs fp8. Anyone who needs the last bit of peak for one single long answer runs bf16.
The next day I measured the three windows a second time with a different probe: not the decode rate the service reports for itself, but the wall time of one warm 1,024-token turn, waiting and cache reading included. At 246,082 prompt tokens per session: bf16 51.4 and fp8 51.3 tok/s per session — identical to the decimal place. That is the figure a user actually feels, and it settles the operational question: with three long windows the pool format is a matter of taste, with four it decides whether the window exists at all. The two series (31 Oct decode rate, 1 Nov wall time) are not interchangeable — 101.8 and 51.4 describe the same configuration on two different scales, which is why the chart keeps them apart.
Finding 3: quality — 66 identical probes, and the refusals are gone
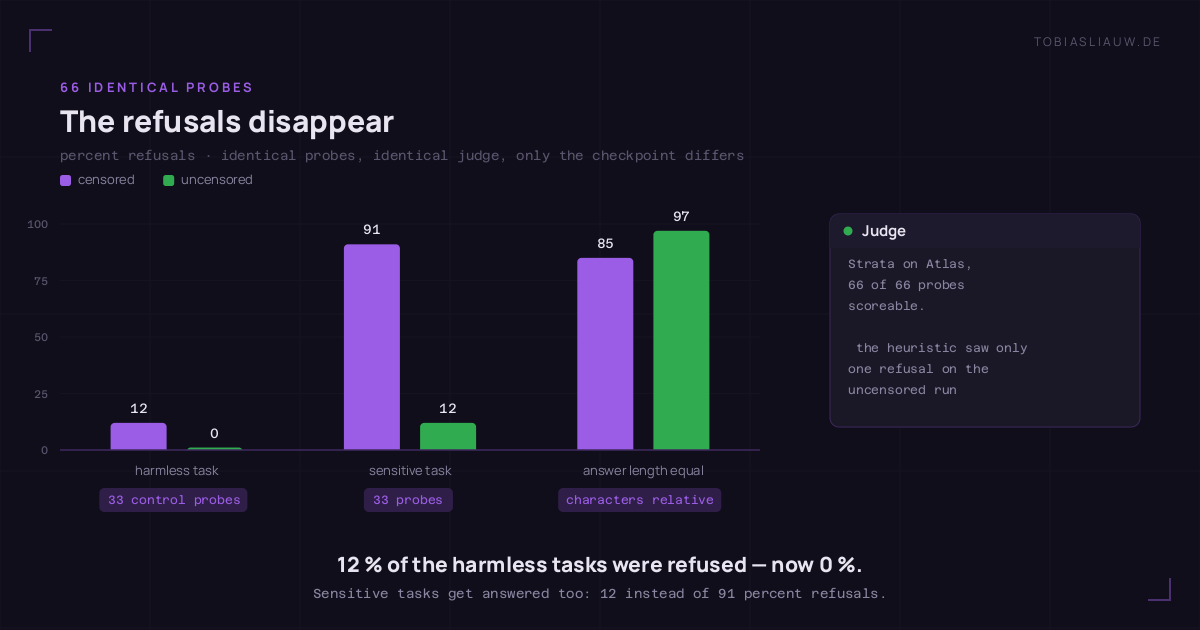
The first measurement on the censored NVIDIA checkpoint had one clear weakness: of 33 harmless control tasks it refused four (sensorics, maintenance schedules, cold-protection questions). Now the same probe set, same judge, with only the uncensored branch (hibrid48-uncensored) underneath:
- harmless tasks: 0 of 33 refusals (before: 4 of 33, 12 percent).
- sensitive tasks: 4 of 33 (before: 30 of 33, 91 percent). The four remaining ones are content decisions; the heuristic saw only one of them as a refusal.
- answer lengths stay equal (1,629 against 1,669 characters on the harmless tasks) — nothing is being starved.
Alongside that, the capability check on the new service: tool calls 3 of 3 correct (name, required field, arguments as JSON), strict JSON passed, a creative writing task answered with 604 characters and no refusal formula. Needle search in long context — measured earlier on the censored service — hit 3 of 3 at 131,072, 3 of 3 at 262,144 and 3 of 3 at 393,216 tokens (55.2 / 115.9 / 179.5 s). And the vision is real: the very chart I built for this article was read with 834 prompt tokens instead of 67 — the image encoder measurably works — and the text names the title, the cards and the watermark correctly.
One operational note that cost me two hours of debugging: this checkpoint answers in the reasoning field, and reasoning: false does not switch the thinking off. A client that reads only content and sends a small token budget receives an apparently empty answer. For tool loops that means: keep the budget generous, or read reasoning as well.
Finding 4: nothing fits alongside — not even a file
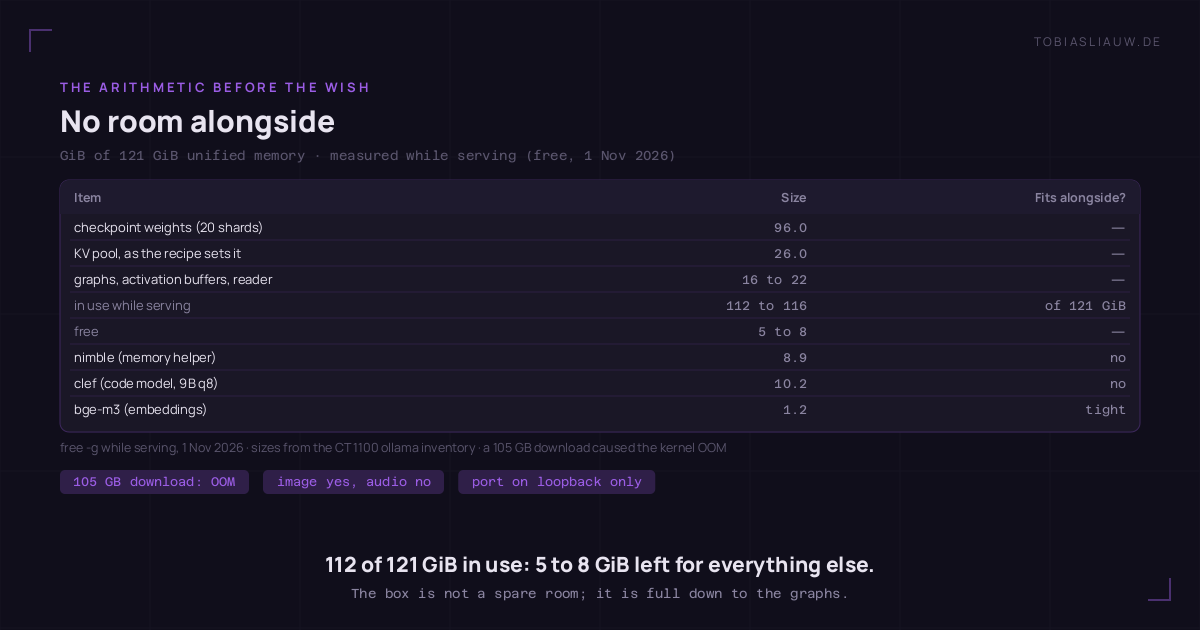
The question „can’t the GB10 take nimble and the embeddings on the side?” I answer with the arithmetic and with two accidents. The arithmetic: 96.0 GiB of weights, the 26.0 GiB key-value pool the recipe prescribes, plus graphs, activation buffers and the reader — while serving, 112 to 116 of 121 GiB are in use, which leaves 5 to 8. nimble needs 8.9, clef 10.2 (so it is even larger), bge-m3 1.2 GiB. The candidate that would most likely work is bge-m3 — loaded in bursts, released again right after the call.
The harder evidence is the download itself: 105.4 GB pulled in 23 minutes, and at the end the running service dead — Out of memory: Killed process (VLLM::Worker). Not the transfer, but the fact that 105 GB travel through the page cache while 5 GiB are free. And the night before, llama-server.service with Restart=always had done exactly the same: an automation on Atlas could not find the old port, restarted the llama.cpp service, and the 79 GiB load attempt made the kernel sacrifice the vLLM process. Against that, a lock file with ConditionPathExists now sits in the unit — start attempts from the outside do nothing, without touching the unit file.
The consequence for the division of labour: nimble stays on Atlas, on the CPU. I measured it: 3.0 tok/s (200 tokens in 81 s) — bearable for nightly memory runs, not for interactive recall. clef is out as a replacement for two reasons: it is larger at 10.2 GiB, and the chat template is missing from its ollama inventory ("clef-flash:9b-q8_0" does not support chat). On the Atlas cards there is no room for either: the engine reports 2,061 MiB of free card reserve at 46.2 of 51.5 GiB used. A slot for nimble on one of the cards first has to be bought — I list that under open.
And what does a token cost?
Both machines hang on their own counters, so we can compute instead of speculating. Atlas reports 350 to 470 watts for the pair of cards in its own telemetry while delivering 107.7 tok/s (single stream, new configuration) — and that is only the GPU side, the ten-core CPU runs next to it near full load. The GB10 reported 69.7 watts at 96 percent GPU utilisation during a 246-thousand-token read — and that is the whole machine, CPU and memory included.
- Atlas: 400 W ÷ 107.7 tok/s ≈ 3.7 joules per token (cards only, CPU not counted).
- GB10: 69.7 W ÷ 148.5 tok/s ≈ 0.47 joules per token (whole machine).
This is a single sample, not continuous operation: I read the GB10 figure once during the read phase, not averaged over decode phases, and the Atlas figure is a snapshot from a load peak. The order of magnitude survives rough errors nonetheless: for long documents this machine works roughly an order of magnitude more energy-lean per token than the pair of cards. That is no argument against Atlas — that is where the interactivity lives, with its tool runs and its finer proposal checking — but it explains why the roles now look the way they look.
What I run, and what is still open
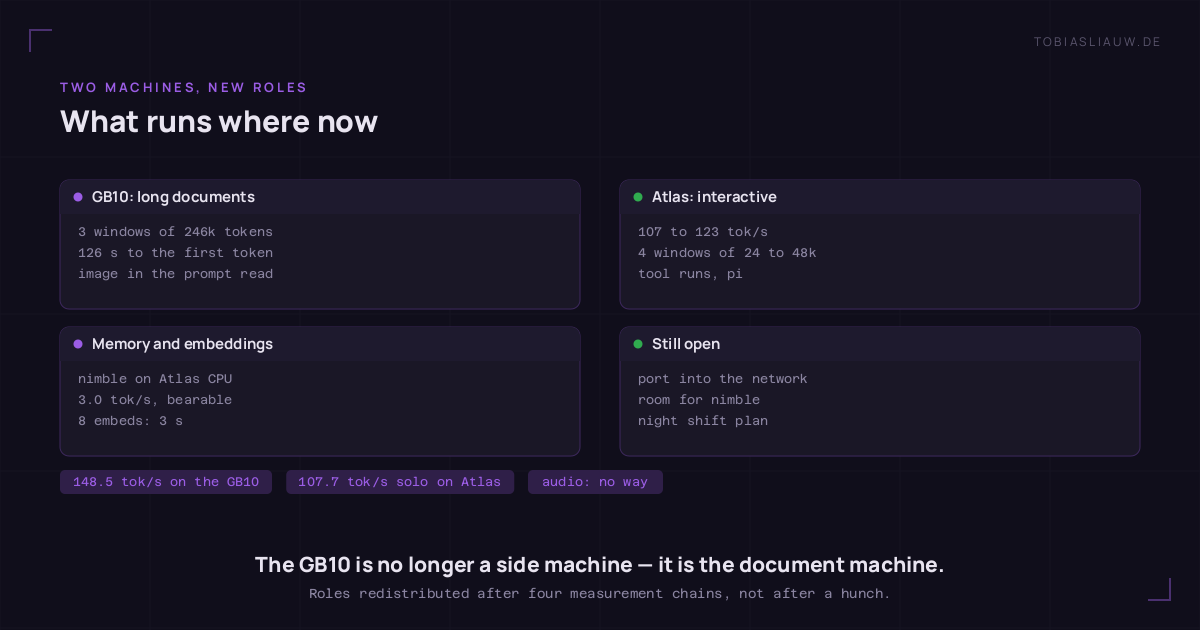
- GB10: uncensored checkpoint, fp8 pool, three seats, proposals at the shipped depth, window 409,600 tokens. The slow background noise is gone: read rate 2,589 tok/s.
- Atlas: stays the interactive machine — 107.7 tok/s single stream, 118.5 with two and 114.9 with four windows, plus the tool runners and pi.
- nimble and bge-m3: on the Atlas CPU, because they do not fit alongside on the GB10; embeddings 8 in 2.96 s, memory texts 3.0 tok/s.
Four things are still pending, and I name them because they influence the decision about a final adoption: first, the container’s port is visible on the loopback interface only; for the fleet the proxy branch of the recipe has to be switched on (a stand-in in front of the service, then the port listens on the network, repetition guard included). Second, the llama.cpp unit has to stay locked permanently, otherwise the old lane wins in case of doubt. Third, I have not yet run the needle search against the fp8 pool (before: 3 of 3 at 393k) and not the full eight-session load test on the uncensored checkpoint. Fourth, the question only the operator can answer: should part of the Atlas card reserve be released for nimble — at the price of a measurably slower interactive stream?
Three honesties
First: every value here holds for this machine, this model and this configuration. The field reports I read name different numbers for the same recipe (37.6 tok/s per session at eight requests, 24.9 at sixteen); what transfers is the direction, not the number. Second: I ran mostly one round per configuration rather than three — the spread is unknown, but the differences between configurations are large enough that this does not explain them. Third: the concurrency figures come from a service with three seats; the four- and eight-session figures come from the censored service with eight seats, which is why the table has no fp8 entry for four and eight sessions on the uncensored checkpoint. And because one field report shows that eight concurrent requests alone can shift thousands of positions, I expect no bit-identity in regression comparisons under concurrency.
Raw data: batch-probe-gb10vllm.jsonl (all session steps), gb10-unc-pruef.json, gb10-unc-gaben.json (image, video, audio), gb10-unc-stichprobe-66 and gb10-vllm-stichprobe (refusal probes), gb10-vllm-nadel-*.json, gb10-unc-fp8-3x250k.json and gb10-unc-bf16-3x250k.json, plus BERICHT.md with all four chains and zusammenfassung.json — in the runs folder of the guardrail harness.
Artefacts
Raw measurements for recomputation: gb10-vllm-zahlen-2026-11-01.json (per-configuration figures as JSON: speed, windows, refusals, modalities, proposal checking, memory, energy) and gb10-vllm-zellen-2026-11-01.csv (measurement rows as CSV: arm, sessions, tok/s, first token, wall time).
The five figures at full size (1200 × 630): Twelve times the speed, same hardware · Three long windows, two pool formats · 66 probes, censored against uncensored · The GB10 memory arithmetic · How the fleet splits the work.