Two nights of measurement on two GeForce RTX 3090s, 112 cells, a production engine restart between every configuration. The question I have been putting off since the autumn rebuild: where does usable long context stop on my 30-billion-expert mixture — and what breaks first when it does? The answer fits in one sentence: The bottleneck is time to first token, not graphics memory — 262,144 tokens cost 139 to 219 seconds of waiting, 131,072 tokens cost 66 seconds, and the KV tier moves that wait by up to 64 seconds without costing a single needle test (four of four tiers find the probe at full context). What follows is the evidence — plus the list of what I did not measure.
This post continues the series about the same machine: how the fleet is built, the GPU patch that was active in every measurement here, and the quant ladder of the same model. Part two of this series measures what happens past 262,144 tokens — rope stretching to 512k and 1 M.
Four questions, one machine, no side products
First: how does time to first token grow with prompt length, and does it break anywhere? Second: what does each quantisation of the key-value cache cost in waiting time — and does it cost quality? Third: does forcing more KV cache into VRAM help, and what changes when other models sit on the cards? Fourth: how many sessions at which context length can I run at once before the wait explodes?
The machine: two RTX 3090s with 24 GB each, the second one on PCIe 3.0 with eight lanes, a container with 72 GB of RAM, a ZFS share for the model files, driver 595.84, Strata engine 0.1.48. The model: qwen3.8-flash-next-abliterated in IQ3_S (3.5 bits per weight, 512 experts per block, ten active per token), native context frame 262,144 tokens, one session slot plus a queue, endpoints on 8080 and 11434. The fleet’s production configuration, which stayed live during the measurements, runs the KV cache as q4_0 with 32 GiB of KV resident in VRAM.
I built the matrix in phases: a0 the context ladder from 8,192 to 262,144 tokens on the int8 middle tier, 27 cells between 22:30 and 07:00; a1 the KV axis — fp16, int8, k8v4, q4_0, each at 0, 20 and 32 GiB residency, at 65,536, 131,072 and 262,144 tokens, 53 cells; a2 rope stretching to 512k and 1 M (part two); a4 the same on the GB10 box; a5 the base grid again after two small models had left the cards; and a quality follow-up that supplied needle tests for every KV tier. Every group boundary carried an engine restart, because the KV cache and the context frame are fixed at start-up.
Measurement hygiene: what counts as a number here
Every cell starts with an idle gate: endpoint idle, no foreign processes, three latency probes with a random word. After a restart the runner waits for the readiness report and checks that the server really advertises the context frame it was told to build; if a group could not be established, the run skipped the cell and restored the production configuration. A watchdog aborted the night when a cell blew its time budget, and the first failure in a group moved on to the next configuration instead of blocking the whole night.
The metrics come from an instrument I built for the patch comparison, with three corrections along the way. First, the server counts now, not my script: prompt size is read from the server’s own prompt_tokens, because my character-based token estimate was off for a model that averages 0.18 words per token. Second, decode is generated tokens divided by total streaming time, the wait for the first token included — deliberately a low number, because it is what arrives at the desk. Third, prefill is a difference measurement: two prompts of different length, (long − medium) divided by the difference in waiting time, which cancels the fixed per-request overhead. First token is the median of two runs with a fresh random prompt and eight generated tokens.
Residual throughput is not a long-context figure: two to eight short requests of 256 tokens go into the same queue at once, and the figure is generated tokens divided by wall time. It says how much short traffic still gets through while the long context works. Each cell also produced a telemetry CSV: utilisation, power, clocks and memory of both cards every five seconds, plus throttle reasons.
Finding 1: the wait grows with the prompt, the rate does not
| setting | context | prompt (server) | first token | prefill tok/s | decode tok/s | needle test |
|---|---|---|---|---|---|---|
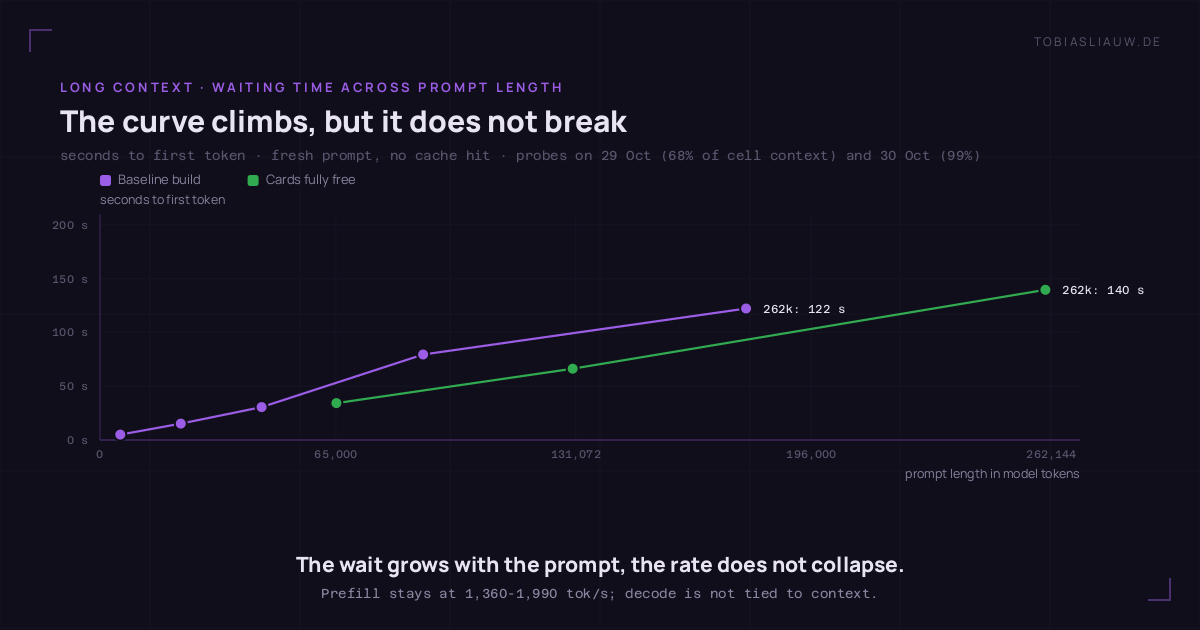
| int8, 32 GiB | 8,192 | 5,583 | 5.04 s | — | 17.7 | — |
| int8, 32 GiB | 32,768 | 22,267 | 15.28 s | 1,626 | 43.9 | — |
| int8, 32 GiB | 65,536 | 44,516 | 30.56 s | 1,613 | 42.3 | 3/3 |
| int8, 32 GiB | 131,072 | 89,012 | 79.44 s | 1,358 | 43.1 | 3/3 |
| int8, 32 GiB | 262,144 | 178,001 | 122.19 s | 1,812 | 42.1 | 2/3 |
| int8, 64 GiB, cards free | 65,536 | 65,131 | 34.27 s | 1,909 | 57.3 | transferred |
| int8, 64 GiB, cards free | 131,072 | 130,242 | 66.25 s | 1,990 | 61.1 | transferred |
| int8, 64 GiB, cards free | 262,144 | 260,469 | 139.52 s | 1,857 | 59.8 | transferred |
Between 5,583 and 178,001 prompt tokens the wait rises from 5.0 to 122.2 seconds — the expected straight line, no kink. Prefill stays at 1,360 to 1,990 tokens per second across the whole ladder, decode sits at 42 to 44 tokens per second and is visibly independent of context length: someone waiting for a 200-token answer at 262,144 context waits no longer for the answer than at 8,192 — only for the first character. The bottleneck is the shore, not the flow.
One value breaks out of line: 17.7 tokens per second decode at 8,192 context. That is the first run of the night, engine cold and expert profiles still learning; the four cells that follow in the same night sit at 43 to 44. I keep the row and mark it instead of quietly deleting it.
Finding 2: the KV tier moves the wait by up to 64 seconds
| KV tier | KV residency | GiB per session (at 262,144) |
first token | prefill tok/s | decode tok/s | residual rate |
|---|---|---|---|---|---|---|
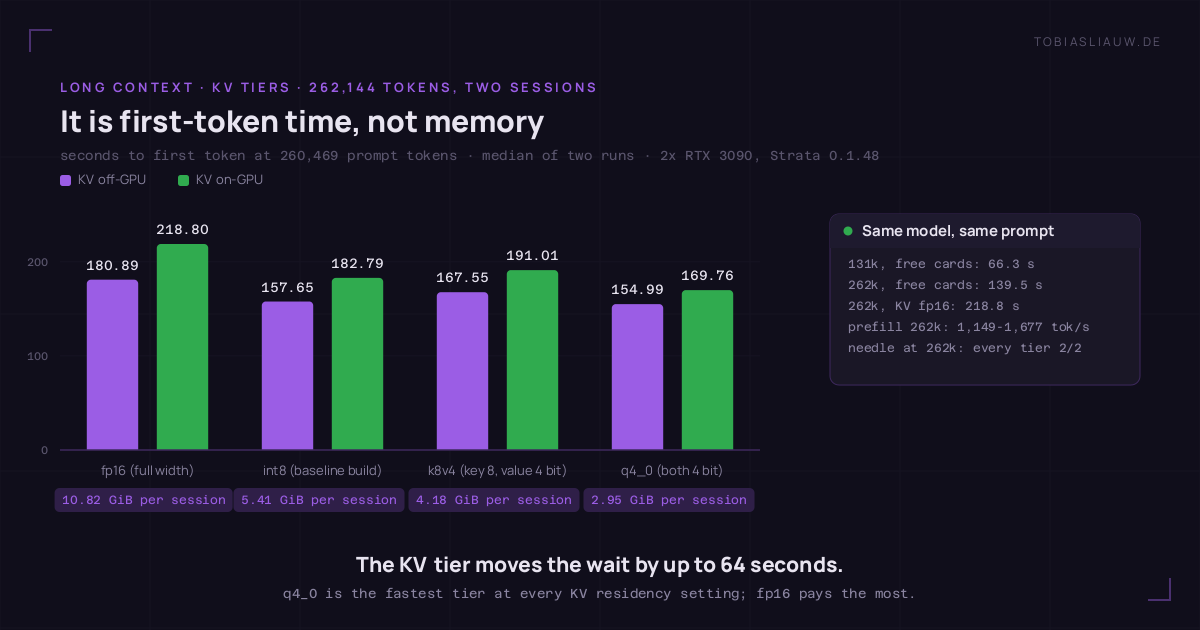
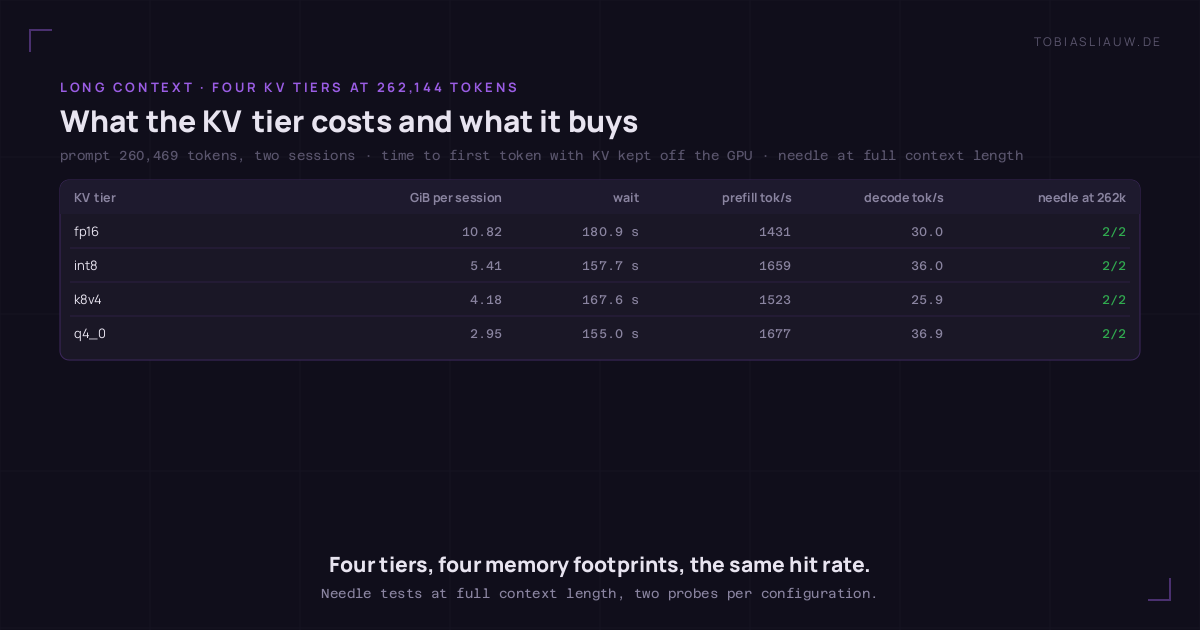
| fp16 (full width) | 0 GiB | 10.82 | 180.9 s | 1,432 | 30.0 | 9.2 |
| fp16 | 20 GiB | 10.82 | 217.7 s | 1,149 | 41.5 | 47.5 |
| fp16 | 32 GiB | 10.82 | 218.8 s | 1,150 | 40.7 | 11.4 |
| int8 (middle tier) | 0 GiB | 5.41 | 157.7 s | 1,660 | 36.0 | 49.5 |
| int8 | 20 GiB | 5.41 | 183.0 s | 1,381 | 41.9 | 19.8 |
| int8 | 32 GiB | 5.41 | 182.8 s | 1,384 | 42.0 | 2.9 |
| k8v4 (key 8, value 4 bit) | 0 GiB | 4.18 | 167.6 s | 1,524 | 25.9 | 22.3 |
| k8v4 | 20 GiB | 4.18 | 191.0 s | 1,325 | 40.8 | 27.5 |
| k8v4 | 32 GiB | 4.18 | 191.0 s | 1,350 | 41.0 | 0.7 |
| q4_0 (both 4 bit) | 0 GiB | 2.95 | 155.0 s | 1,677 | 36.9 | 14.8 |
| q4_0 | 20 GiB | 2.95 | not measured | — | — | — |
| q4_0 | 32 GiB | 2.95 | 169.8 s | 1,540 | 24.0 | 10.5 |
The ordering is the same at every residency: q4_0 is fastest, fp16 slowest. At zero residency q4_0 (155.0 s) and fp16 (180.9 s) are 26 seconds apart, at 32 GiB they are 49 seconds apart (169.8 versus 218.8) — the largest gap a KV decision produces anywhere in this matrix. Prefill follows the same order: 1,677 against 1,150 tokens per second, a factor of 1.46. What the choice does not cost is the next section.
For KV residency I had expected the opposite: more cache in VRAM should be faster. Measured, it is slower for int8 and k8v4 — 157.7 to 182.8 seconds, 167.6 to 191.0. The plausible reason sits in the configuration file: KV residency is squeezed into the same memory as weights, expert cache and the vision branch, and whatever does not fit is pulled off the second card through the peer reserve. Less KV in VRAM therefore means more room for experts on this machine — and expert hits matter more than KV residency. With q4_0’s small footprint the effect is smaller (155.0 to 169.8).
Finding 3: four KV tiers, four memory footprints, one hit rate
| KV tier | KV residency | needle test at 262,144 | median prompt | answer time |
|---|---|---|---|---|
| fp16 | 32 GiB | 2/2 | 261,802 | 240.1 s |
| int8 | 32 GiB | 2/2 | 261,701 | 153.1 s |
| k8v4 | 32 GiB | 2/2 | 222,545 | 261.4 s |
| q4_0 | 32 GiB | 2/2 | 261,827 | 233.0 s |
| q4_0 | 0 GiB | 2/2 | 241,868 | 139.3 s |
| int8 (first pass, three depths) | 32 GiB | 2/3 | 262,133 | 202.2 s |
| int8 (first pass, 131,072) | 32 GiB | 3/3 | 130,939 | 93.7 s |
Not one of the four KV tiers loses the probe. Ten probes in five configurations, ten hits — with 4-bit KV exactly as with uncompressed fp16, at 2.95 GiB exactly as at 10.82. The speed advantage of q4_0 comes free on this machine. That the fleet has been running it since the autumn now rests on two legs instead of one.
The one missed probe belongs to the story: in the first pass the 90-percent depth ran with a prompt of 262,133 tokens — 11 tokens below the hard limit — and the answer came without the marker. The same configuration found it at half and top depth with 260,906 and 261,957 tokens. I read that as an edge effect rather than a quantisation effect: the last kiloton of the window is unreliable, plan a buffer. The re-run with two depths found both probes in the same configuration.
Finding 4: memory only bites once the KV cache runs out of room
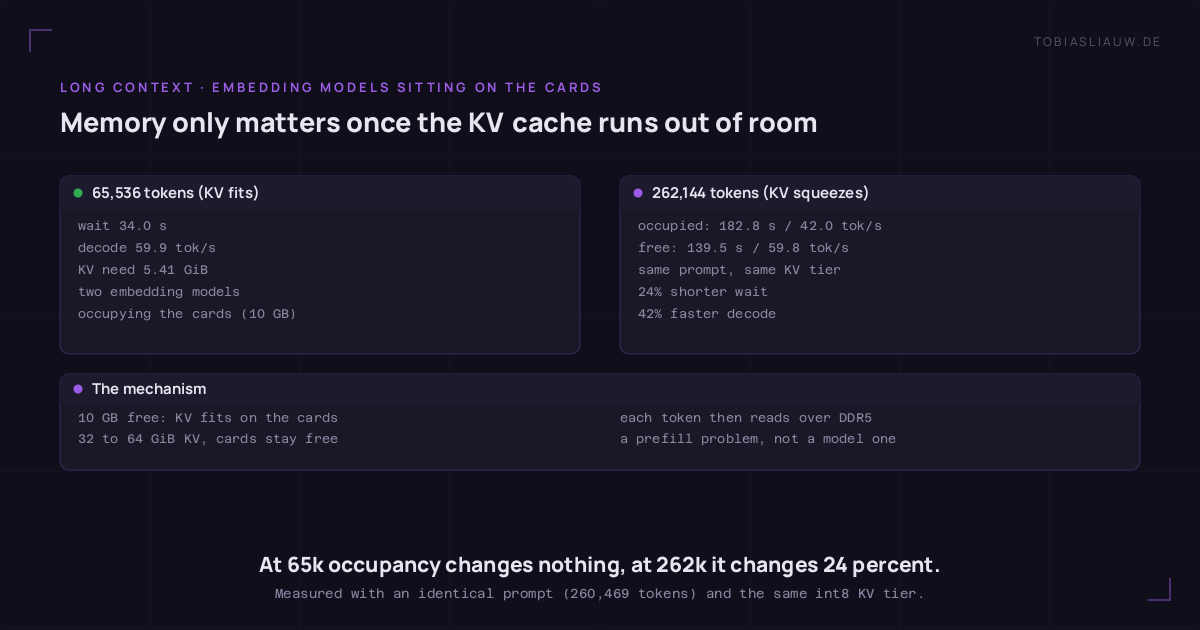
Before the second follow-up I took two small models off the cards — a router decision model and an embedding model, together about 10 GB. At 65,536 tokens that changed nothing measurable: 34.02 versus 34.27 seconds to first token, 59.9 versus 57.3 tokens per second decode — the same cell in two worlds. At 262,144 tokens it was 182.8 versus 139.5 seconds (24 percent shorter) and 42.0 versus 59.8 tokens per second decode (42 percent faster).
The mechanism matches Finding 1: while a session’s KV cache fits into free VRAM it is invisible. Once it does not, the cache moves to system RAM and every token of the long prompt reads over DDR5 instead of the card. Two caveats: the pair differs not only by the models on the cards but also by KV residency (32 versus 64 GiB) and by time of day (morning versus four in the morning; telemetry shows 79 to 94 percent of samples with card activity from the measurement itself in both). A clean pair at identical residency is still outstanding; the direction agrees with what the engine reports for its reserved memory.
Finding 5: the sweet spot is 131,072 tokens times eight sessions
| context | sessions | first token | decode tok/s | residual rate | prefill tok/s | card peak |
|---|---|---|---|---|---|---|
| 65,536 | 2 | 34.27 s | 57.3 | 64.3 | 1,909 | 22,201 MB |
| 65,536 | 4 | 41.97 s | 57.8 | 33.4 | 1,640 | 22,201 MB |
| 65,536 | 8 | 34.44 s | 64.9 | 77.9 | 1,891 | 22,201 MB |
| 131,072 | 2 | 66.25 s | 61.1 | 80.2 | 1,990 | 22,187 MB |
| 131,072 | 4 | 67.11 s | 63.0 | 76.1 | 1,959 | 22,201 MB |
| 131,072 | 8 | 66.35 s | 61.8 | 78.0 | 1,980 | 22,201 MB |
| 262,144 | 2 | 139.52 s | 59.8 | 52.8 | 1,857 | 22,187 MB |
| 262,144 | 4 | 152.24 s | 61.1 | 77.6 | 1,656 | 22,187 MB |
The row 131,072 × 8 answers the fourth question: run to its limit the machine holds 1.05 million tokens in memory and still delivers 78.0 tokens per second of short-request throughput while the long contexts work. The wait per request stays flat — going from two to eight sessions at 131,072 tokens moves it from 66.25 to 66.35 seconds, because the engine queues prefills instead of running them side by side. Anyone processing several long documents at once therefore pays in throughput per session, not in waiting time.
Double rooms are the reason I asked the KV question at all: the router guarantees KV cells per session. At 131,072 tokens and 2.71 GiB of int8 KV per session, eight sessions are 21.6 GiB — bearable because the cache is compressed and part of it lives in RAM. Uncompressed (fp16, 5.41 GiB per session) that is 43.3 GiB, and 86.6 GiB at a full 262,144 tokens per session. Without a compressed KV cache this grid would be two sessions wide, not eight.
What I did not measure
Four gaps, each with a reason. First, quality beyond retrieval: I tested finding, not reasoning — no classification or summarisation task across the full context, no perplexity. A needle-test rate is a floor for retrieval, not proof of quality. Second, the slot axis: the engine would rather have guaranteed cells per session, and how guaranteed cells trade against the number of session slots (one slot plus queue against four slots) remains open on this machine. Third, the dense 27B quant ladder at long context is missing — the file did not fit into the free space on the model disk, and I did not want to clean up in the middle of a measurement night. Fourth, the KV residency pair (32 against 64 GiB) at identical card occupancy, which would make Finding 4 airtight.
Three further limits I will not talk away: every cell comes from one model and one engine version; medians rest on two runs per cell, because a repeat of a 260,000-token prompt costs a good two minutes and the night had to carry 27 to 53 cells; and some cells ran with production traffic alive because the production instance was never switched off — the idle gates before each cell catch what they can, and the telemetry records it per cell.
What I take from it
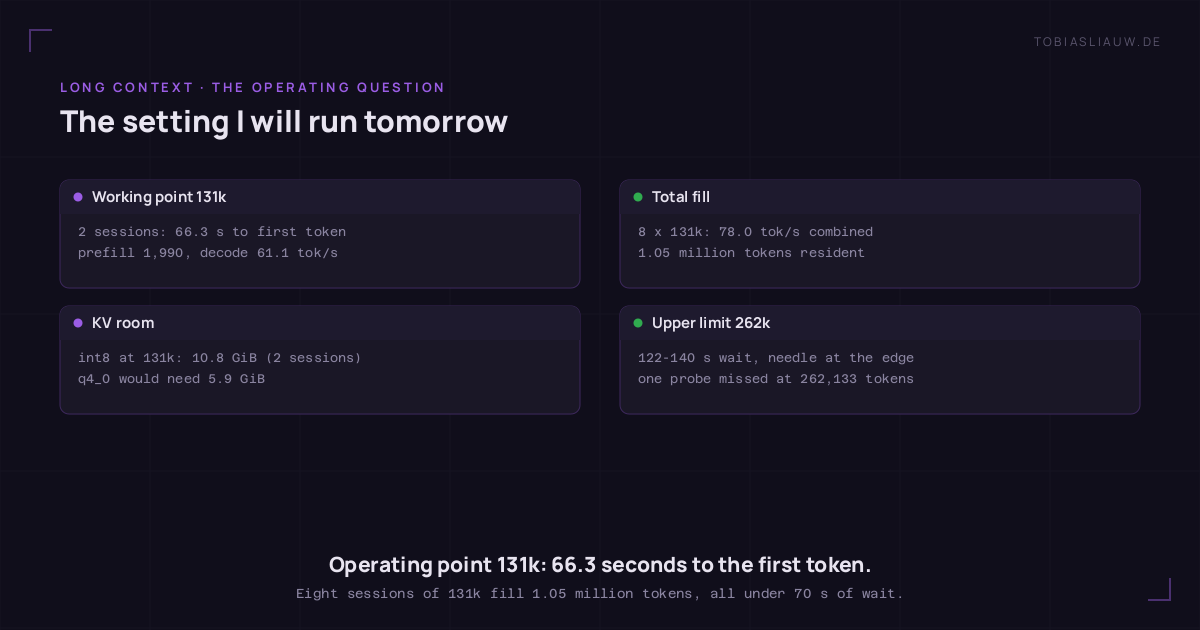
Four decisions, all effective immediately: First, the KV cache stays on q4_0; the measurement confirmed the suspicion in two directions (fastest tier, no hit rate lost). Second, the interactive working point moves to 131,072 tokens — 66 seconds of waiting are still survivable at a desk, 139 to 219 seconds are not; for batch work across several documents I take eight sessions and budget 78 tokens per second of combined throughput. Third, I never plan a context window without buffer: the one missed probe sat 11 tokens below the limit, so I order 245,000 rather than 262,144. Fourth, the small models stay off the cards the big one needs — moving them cut the wait at the edge of the window by 24 percent.
Part two of the series measures what lies beyond the window: the same machine with rope stretching to 512k and 1 M tokens, the needle-test rate, the answer time of a full pass — and what runs differently on the GB10 box.
Artefacts
The measurements as open files: all metrics as JSON (medians per cell, provenance timestamps, individual needle-test results) and the cells as CSV (phase, KV tier, residency, context, sessions, prompt size, first token, prefill, decode, residual rate, card peak, needle rate). The matrix is built by a phase runner that rewrites the engine configuration before each group and restores it afterwards; the instrument, the needle checker and the evaluator live in the same harness I built for the patch comparison.
The five figures at full size (1200 × 630): It is first-token time, not memory · The curve climbs, but it does not break · What the KV tier costs and what it buys · Memory only matters once the KV cache runs out of room · The setting I will run tomorrow.